
Variography
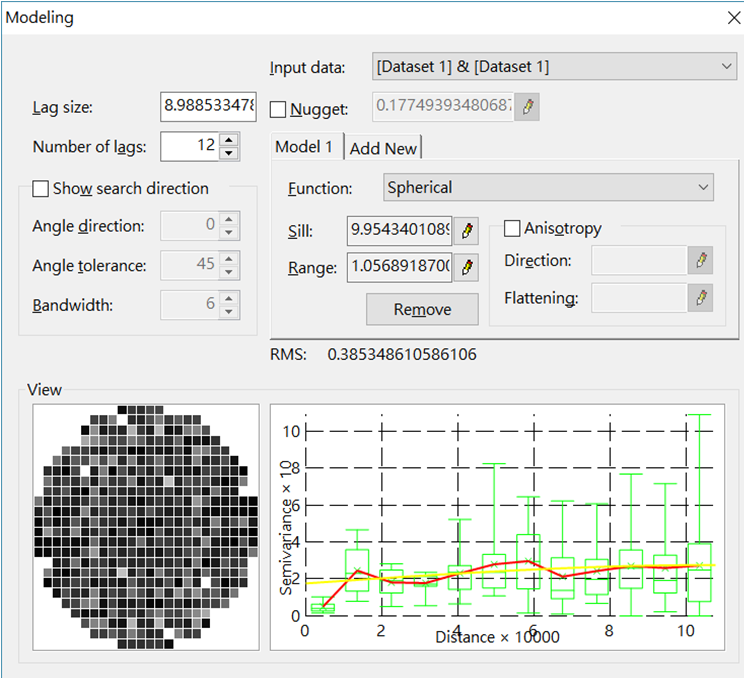
When we calculate pair data with the variable function γ(h), all the data will be gathered together and presented in a statistical graph according to different h values. It can provide the experimental semivariography, average variable function in a range, and simplify the functional curve of variance to advantage the fitting models, as shown in the following graph.
Besides, box plot is also provided to allow users to know the variance maximum value, minimum value, and average value of the calculated samples in a certain distance.
©2017 Supergeo Technologies Inc. All rights reserved.