
The Variance Theory Model of Spatial Statistical Analyst
The spatial analysis hypothesizes that the closer distance the 2 points are, their relations of similarity or correlations will be stronger. On the contrary, the longer the distance between 2 points is, the correlation between them will be lower. The theories of semivariograms and covariance are based on the correlations between 2 points with their varied distances. In other words, this concept could be quantized through equations.
Assuming that the definition of a variogram model is: ![]()
Where var is a variance,![]() and
and![]() are 2 different points,
are 2 different points, ![]() and
and![]() are the values at point
are the values at point![]() and
and![]() , and the distance between the 2 points is
, and the distance between the 2 points is ![]() . If the distance between the 2 points is short, we see the 2 points are similar. It means that the differences between
. If the distance between the 2 points is short, we see the 2 points are similar. It means that the differences between![]() and
and![]() are smaller. When the distance between the 2 points increases, the similarity decreases. It means that the values between
are smaller. When the distance between the 2 points increases, the similarity decreases. It means that the values between![]() and
and![]() are rising. We can use a curve graph to present a typical semivariogram:
are rising. We can use a curve graph to present a typical semivariogram:
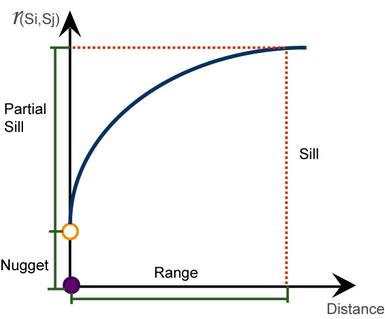
The height of the curve (the Y value to which the coordinate of the x point where the curve starts its parallel stretch corresponds) is the “Sill”. The “Sill” has 2 parts: Nugget Effect and Partial Sill. Nugget Effect is a discontinuity line at the point of origin. This may be caused by measurement errors and microscale variation. The measurement errors and microscale variation could be 0, respectively, so the Nugget Effect could be caused by either one or the other. The distance of the curve from the point of origin to the “Sill” is called “Range.”
The concept of Covariance could be seen as another expression of variogram, and the definition of its equation is:
![]()
Where the covariance is cov, ![]() and
and![]() are the 2 different points,
are the 2 different points, ![]() and
and![]() are the values at point
are the values at point ![]() and
and![]() , and the distance between the 2 points is
, and the distance between the 2 points is ![]() . The covariance could be seen as a scale for measuring the autocorrelation between the 2 points. If
. The covariance could be seen as a scale for measuring the autocorrelation between the 2 points. If ![]() and
and ![]() are close to each other, the 2 points are considered as similar, and their covariance should be greater. When the 2 points are far away from each other, their similarity will decrease down to 0. We can understand the basic hypothesis of the covariance from the following graph:
are close to each other, the 2 points are considered as similar, and their covariance should be greater. When the 2 points are far away from each other, their similarity will decrease down to 0. We can understand the basic hypothesis of the covariance from the following graph:
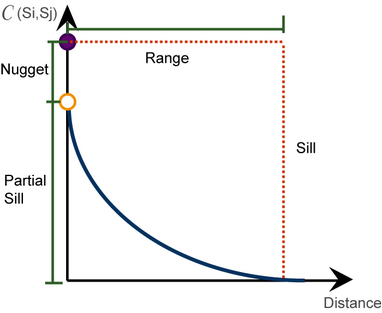
From the above graph, we learn that the covariance decreases with the increase of distance. Therefore, we can see it as a similar equation.
Spatial Statistics provides you the analyses of semivariogram and experimental semivariogram. You can use different estimation methods (the Kriging, Co-Kriging and Indicator-Kriging) to fit in different models (the Spherical Model, Exponential Model, and Gaussian Model). You can also limit your search range through direction settings. The following chapter is going to introduce how to operate.
©2017 Supergeo Technologies Inc. All rights reserved.