
Isotropy and Anisotropy
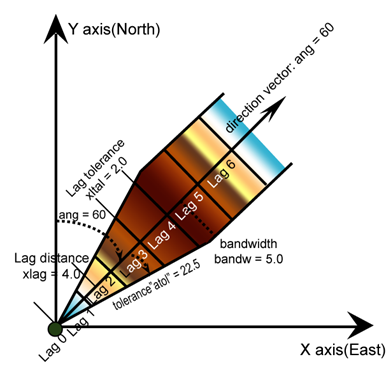
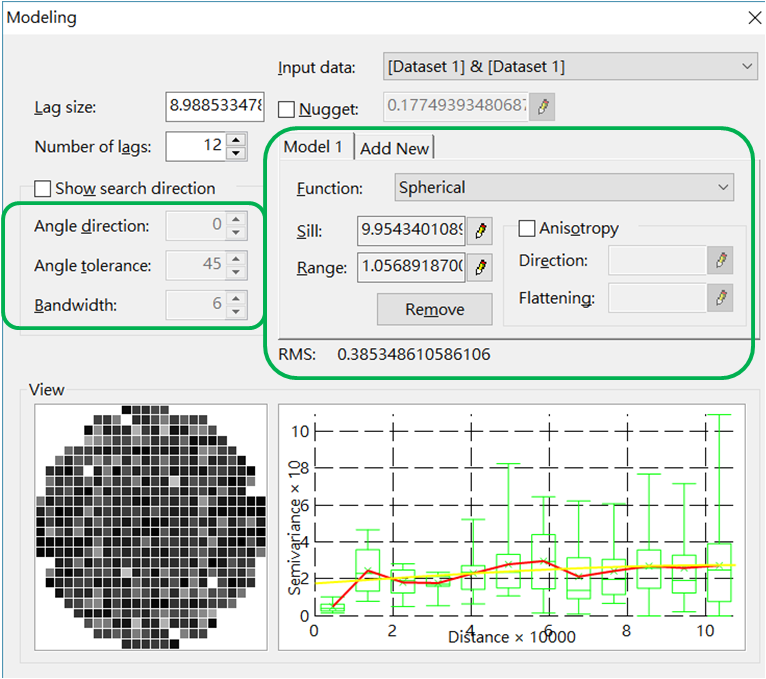
Geostatistics applies a variogram to present spatial variability and a variogram model is also a distance function. The results of isotropy and anisotropy are shown in the red circle of Zone A. Users can input values manually and see their distributions and directions in different angles. In addition, through adjusting the tolerance angles, users can decide if the nearby points in the bandwidth will be considered as search targets. Through adjusting the bandwidth, users can decide which pairs will be in the search width which is needed for drawing a semivariogram, as shown in the red circle of Zone B. When users collect data from all directions to process variance analysis, the analysis result will approximate the real situation.
©2017 Supergeo Technologies Inc. All rights reserved.