
Experimental Semivariogram Model
In this section, we will try to understand the correlations between the entire measuring points through the experimental semivariogram. The results obtained from the semivariances can help us understand that the curve (the yellow curve in the graph) passing through the model best fits all points in the model.
The meaning of semivariogram is to orrelate a semivariance and distance and to display this correlation in the graph. This helps us understand the correlations between data points and their nearby points.
In the dialogue box of semivariogram, you can create spatial correlation models among different datasets. In the system defaults, the model is established by using the Spherical Model to calculate the best-fit parameters. Through the process of setting up proper intervals, you can avoid being unable to estimate a trend because of the mess of a great deal of sample points. The intervals are the distances between point groups, and this can reduce the mess possibly caused by a great deal of groups. A proper interval can also well advantage establishing the spatial correlations. In addition, the parameters influencing the model are Nugget, Range, and Sill.
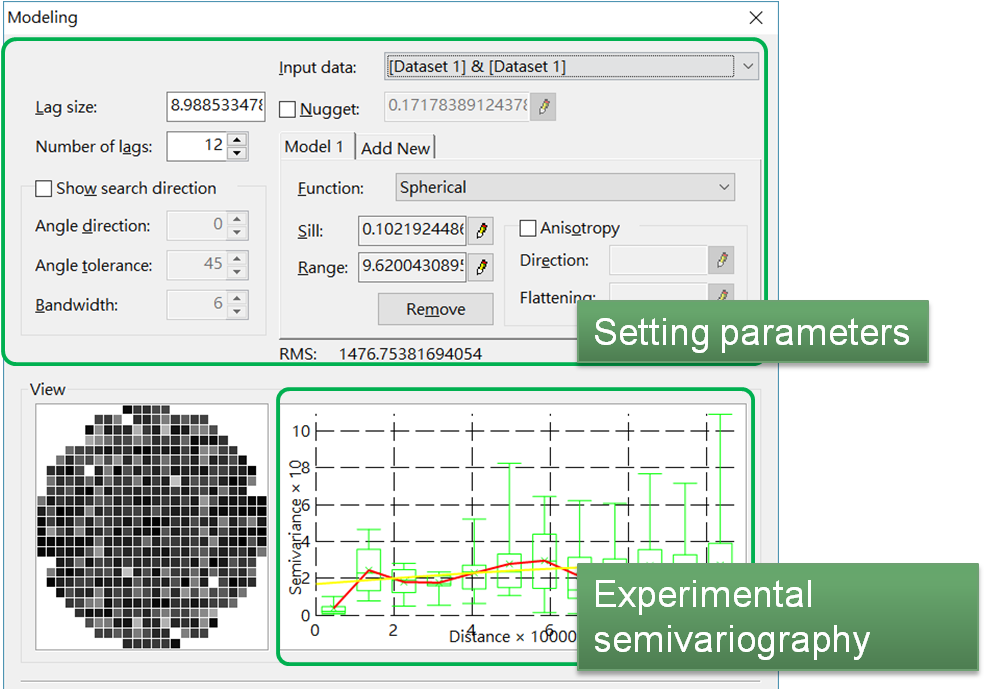
First of all, you can change the related parameters to change the fitting models in the experimental semivariogram and to obtain a better solution.
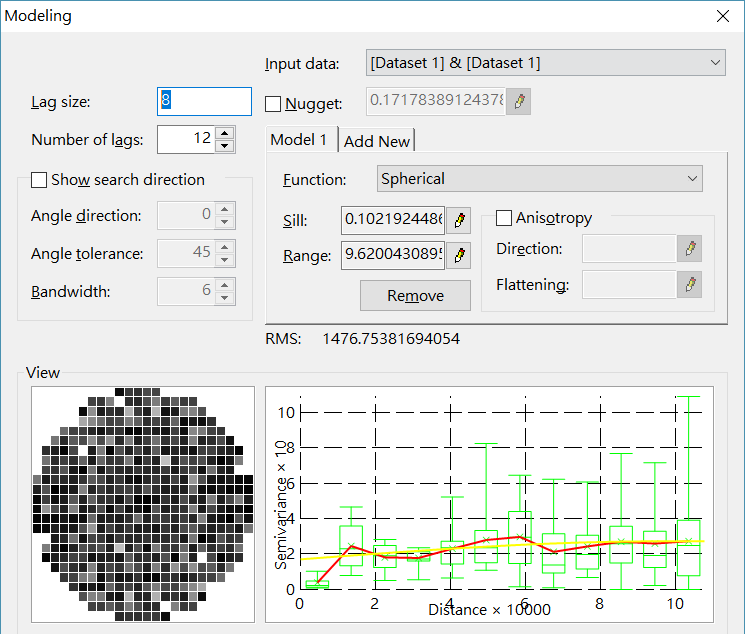
1.Input 8 in Lag Size.
2.Input 12 in Number of Lags.
The X-axis of the semivariogram represents the collection of distances between data points- the average variance of any 2 points with the same distance. Its semivariance on the Y-axis is the base for the following estimation process- a data point have a certain variance in a certain interval. Therefore, this value could be considered as the standard of point variability. The above example shows us that the values of semivariogram are smaller in a short distance, the lower variability is. With the extension of the distance, the values of semivariogram are getting higher. The longer the intervals are, the higher the variability is.
©2017 Supergeo Technologies Inc. All rights reserved.