
Directional Semivariogram
In addition to the influences of distances, directions may also influence spatial data, for example, wind directions in the natural phenomenon, the man-made industrial division, directions of geological structures, water-flow directions, etc. These directional influences are called “Anisotropy”.
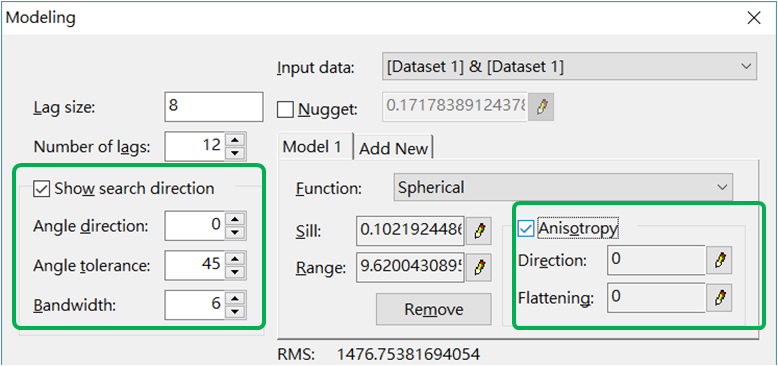
Now, through “Show Search Direction”, we can analyze if the change of data has its specific direction. This function does not affect the estimations, but helps you understand your data via the changes of semivariogram from the semivariogram dialogue box.
1.Check Show Search Direction to display the search extent in the display zone. The following demonstration could be used as reference for setting the calculating angles.
2.Check Anisotropy and input the value in Direction to set up angles to be analyzed. Through variability calculations of different angles, we can obtain different semivariograms. This may help us to find out the most correlated data along a certain direction amongst sample data.
©2017 Supergeo Technologies Inc. All rights reserved.