
Benning
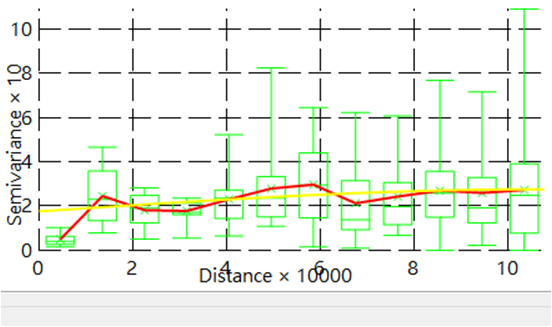
The experimental semivariance scatter diagram is drawn by the distance (as the X-axis) and the square of the differences between 2 points (as the Y-axis). When we encounter tremendous sample points, it will become messy and we may not be able to analyze any trend. The experimental semivariogram can group different datasets according to their different intervals between paired points in order to reduce distribution points. This process is called “Benning.”
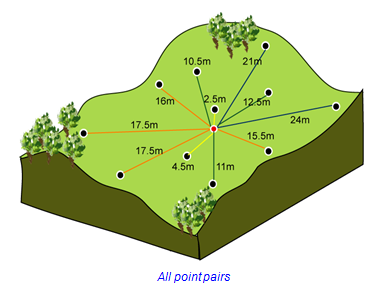
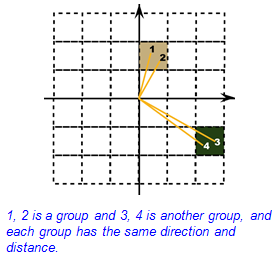
Benning contain 2 major steps. The first one is to form point pairs. The second one is to form group pairs, and each group has the same direction and distance.
During the processing, the more points are, the more pairs could be created. The process also becomes more complicated. In the experimental semivariogram, each bin uses the average distance and average semivariance of its all pairs as a point, and this point will be drawn in the semivariogram.
©2017 Supergeo Technologies Inc. All rights reserved.