
Basic Statistics of Samples
1.Add a point layer and the sample point layer will be displayed in the map window.
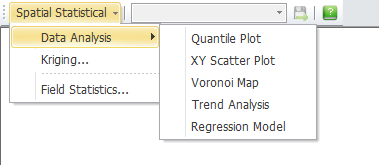
2.Click Data Analysis on the dropdown menu of Spatial Statistical Analyst. It provides quantile, scatter plot, thiessen's polygon, trend analysis and regression analysis. To understand more please read the following section.
Quantile
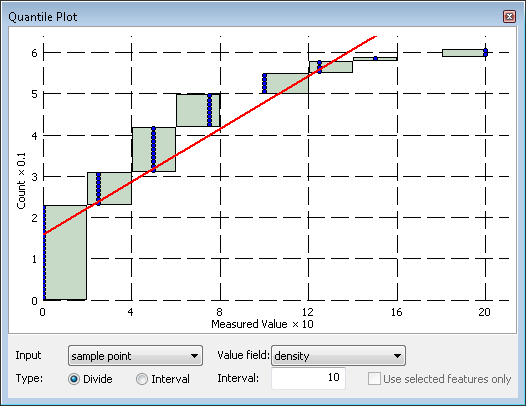
The quantile graph classifies values in different groups and sums up the count of each group. Users can observe the cumulative number and the amount of data in each group. Users should select a layer and a field, and then choose how to separate the data. If you already selected some features on the map, you can check “Use selected features only” so you can analyze with the selected features on the map only. If no feature is selected on the map, this item will be disabled.
Scatter plot
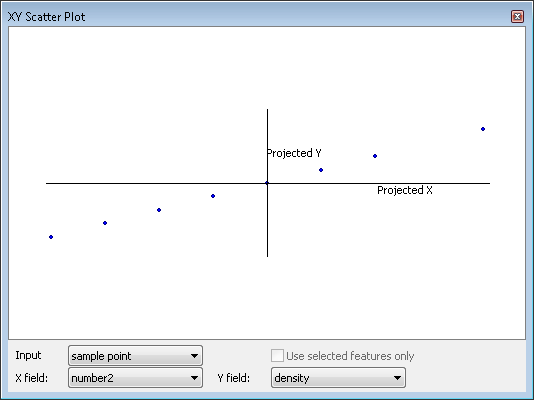
Scatter plot puts two variables on the 2-dimension plot to capture if there is a correlation between paired data, such as the relationship between rainfall and slope, the relationship between weathering rate and soil specific components. Users can select the layer and variables as X and Y fields. If you already selected some features on the map, you can check “Use selected features only” so you can analyze with the selected features on the map only. If no feature is selected on the map, this item will be disabled.
Voronoi Polygon
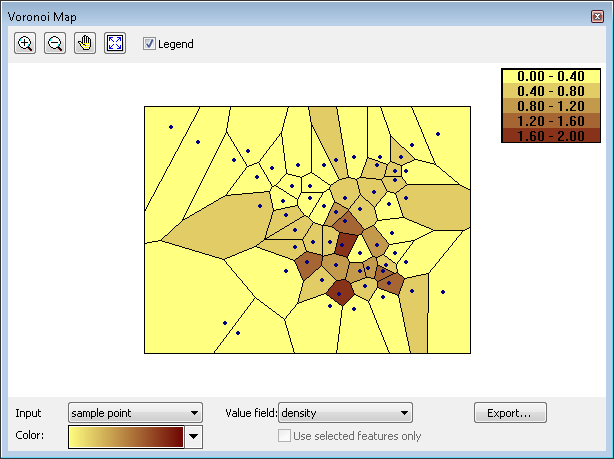
Voronoi Polygon Method is usually applied to estimate values while the status of limited sample points. Voronoi polygon methods connect adjacent sample points with straight lines to form multiple triangles. For each triangle edge, the perpendicular bisectors are generated, which form the edges of the Thiessen polygons. While using, users should select a layer and file for analyzing, and the dialogue will display the Thiessen's Polygon. This result can be exported as a new feature layer. If you already selected some features on the map, you can check “Use selected features only” so you can analyze with the selected features on the map only. If no feature is selected on the map, this item will be disabled.
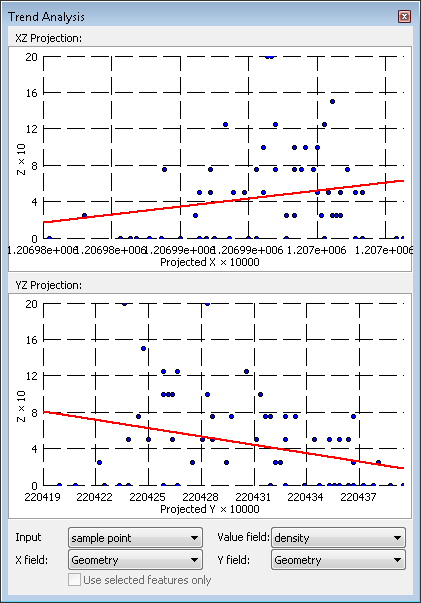
Trend analysis
When doing spatial statistics, it is necessary to consider if value pattern in data is discrete, or intensive, and also find the extreme values. Trend analysis can help us to quickly catch the value distribution and make Kriging analysis more accurate without the influence of the extreme value. Trend analysis displays the data on the XZ projection plane and YZ projection plane. Users can select analyzed layer and fields. If you already selected some features on the map, you can check “Use selected features only” so you can analyze with the selected features on the map only. If no feature is selected on the map, this item will be disabled.
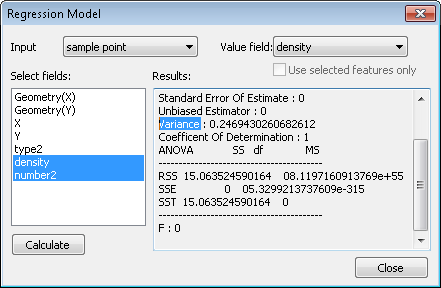
Regression analysis
Regression analysis is a statistical analysis, the purpose of the analysis is to estimate the relationship between two or more variables, and build a mathematical for predicting the particular variable. Users can select one or more variables in the dialog, and selected variables will be highlighted. If you want to cancel the selection, just click the variable again. After selecting, press the calculate button, the result will be listed in the results on the right side. The result includes the standard error, variance and ANOVA.
©2017 Supergeo Technologies Inc. All rights reserved.