
Trend
Analyst simulates the trends of spatial distribution and the regional change using the mathematical curved surface. It calculates a mathematical curved surface to simulate the trend of regional change. Physically, it simulates the regular pattern of the distribution of the geographical elements to display the spatial and regional trend of change of the geographical elements by regression principle.
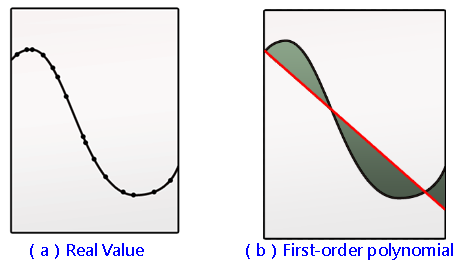
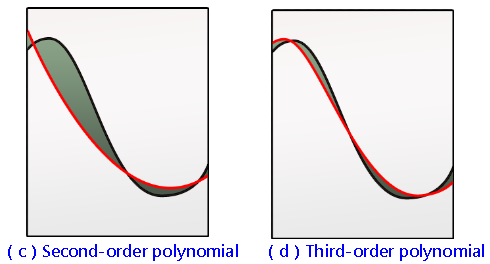
See the figures above, (a) the distribution of original sample data points. (b) the flat trend surface, the estimative result of first-order polynomial(linear). We can find the line cannot cover all sample points. (c) the estimative result of parabola polynomial (one curve is second-order polynomial). (d) the cubic polynomial(two curves is third-order polynomial). We find the coverage effect becomes better with higher order polynomial. In SuperGIS Spatial Analyst 3, twelfth-order polynomial is the highest.
Trend Analyst can be used to simulate the spatially regular pattern of distribution of resource, environment, population and economic factor. The lower order polynomial can be used to express the smaller spatial data; the higher order polynomial can be used to express the more complex spatial data.
Description of Parameters
Item |
Description |
Data Type |
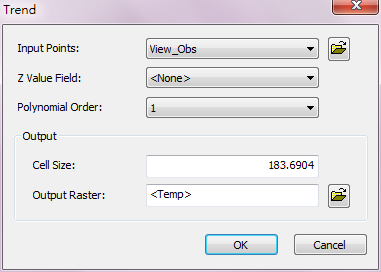
Input Points |
The data to perform trend analysis. |
Feature layer(point) |
Z Value Field |
The weight or value to calculate. |
Attribute Field |
Polynomial Order |
polynomial order, the value must be an integer, ranging from 1 to 12, the default is 1. |
Integer |
Cell Size |
The cell size of the output raster. |
Integer/floating point |
Output Raster |
The filename and storage path of the output raster. |
Raster layer |
©2016 Supergeo Technologies Inc. All rights reserved.