
Neighborhood Analysis
Neighborhood statistics contains Focal(overlapping) and Block(non-overlapping).
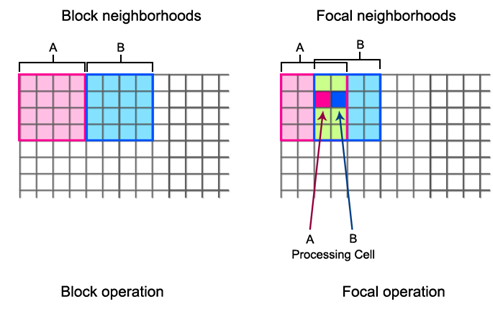
Focal:
Focal is the overlapping statistics. Cell-by-cell it calculates each pixel of the input raster based on a statistics type within the specified neighborhood.
Block:
Block is non-overlapping statistics. It calculates statistics for each pixel within a non-overlapping window. The operation principle is as below:
1.Specify the type of neighborhood.
2.Calculate the size of the block to analyze based on the assigned type and parameters(the unit can be pixel or map unit).
3.Partition the input rasters based on the block size and the blocks can not overlap each other.
4.Calculate and re-define the output cell location in the block.
5.Output statistics result.
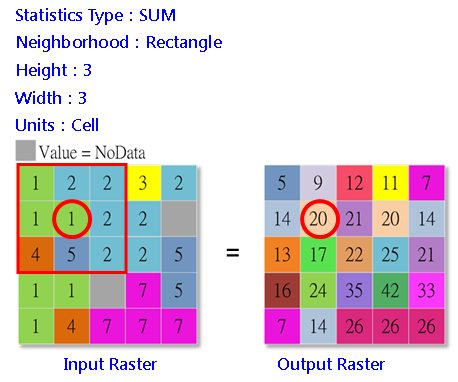
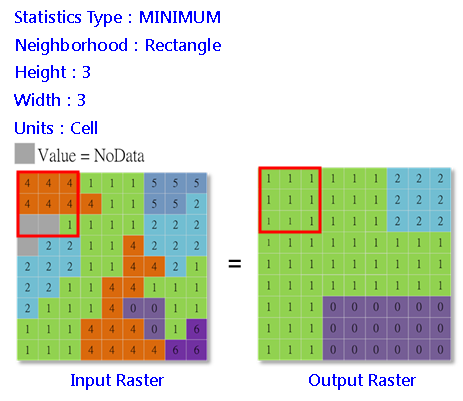
To each cell of the input rasters, Neighborhood statistics help users obtain the processed cell values and the statistic value of the cell values in the specified neighborhood. Then, the system assigns the obtained statistic value to the corresponding cell location in the output raster.
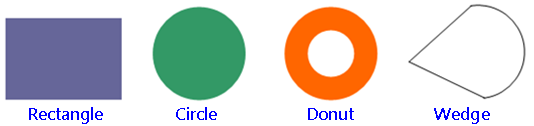
The neighborhood shape can be set to rectangle, circle, donut (a ring similar to a donut shape) or wedge.
Neighborhood type
The neighborhood type contains Rectangle, Circle, Donut and Wedge.
The default of width and height is a raster of 3x3, which can be changed based on users needs. The position of processing cell can be get by the formula below:
X = ( Width + 1 )/ 2 Y = ( Height + 1 )/ 2 |
•![]() Circle
Circle
The size of circle is determined by radius. In neighborhood statistics, the processing cell is the center of the circle, the range within the radius of the circle is the analyzing range. |
•![]() Donut
Donut
The raster within the inner circle (created with a given radius and the center of the circle is the center of the raster) is not contained in the neighborhood statistics. The outer circle (also created with a given radius and the center of the circle is the center of the raster) determines the entire range for the neighborhood statistics. The processing cell is the center of the circle, after both the inner and outer circles are digitized, the rasters inside the outer circle and outside the inner circle will be calculated. |
•![]() Wedge
Wedge
Users need to define the size and range of the wedge by setting the radius, start corner and end corner. Setting radius for the wedge is similar to setting the radius for the circle neighborhood. The degree of the start corner of the wedge can be any integer or decimal from 0 degree to 360 degrees. The start point is the positive X-axis (3 o'clock direction) and ascends in counterclockwise direction till the degree you set. The degree of the end corner can be any integer or decimal from 0 to 360 degrees as well. Once the radius, start corner and end corner are set up, a wedge neighborhood can be determined and be included in calculation. |
Ignore NoData in calculations
"Ignore NoData in calculations" will ignore all the cells whose value is NoData in neighborhood in calculations. If the processing cell is NoDada, the other valid value within the neighborhood will be used to continue to calculate. If the item is unchecked, any cells in the neighborhood have the value of NoData will result in NoData in the output raster.
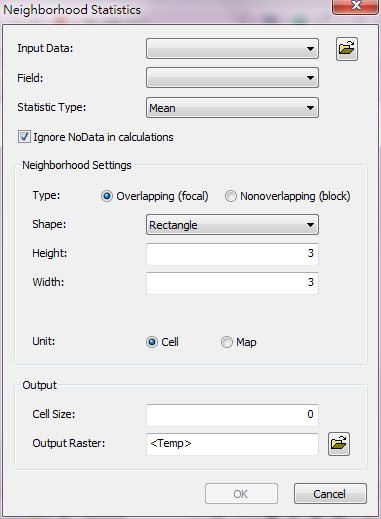
Description of Parameters
Item |
Description |
Data Type |
Input Data |
The raster is the accordance to define the position of each cell. |
Raster data/Constant |
Field |
The weight or value to calculate. |
Attribute field(feature class only) |
Statistic Type |
The statistics methods •Minimum: to get the input minimum •Maximum: to get the input maximum •Range: to get the difference of maximum and minimum •Sum: to get the sum •Mean: to get the mean •Standard Deviation: to get the standard deviation of the input •Variety: to get the variety of the input •Majority: to get the Majority deviation of the input •Minority: to get the Minority of the input •Median: to get the Median of the input |
Analysis option |
Ignore NoData in Calculations |
Whether to ignore the cell that is NoData in neighborhood |
Analysis option |
Type |
Specify the overlay type to move neighborhood: •Focal •Block NOTE: If you use feature layer as the input data, the Type will be specified as Overlapping (focal) and set as disabled by default automatically. |
Analysis option |
Shape |
Specify the neighbor shape: •Rectangle •Circle •Donut •Wedge |
Analysis option |
Unit |
Set the unit: •Cell •Map |
Analysis option |
Cell Size |
The cell size of the output raster. |
Integer |
Output Raster |
The filename and storage path of output raster. |
Raster Data |
©2016 Supergeo Technologies Inc. All rights reserved.