
Exercise 2 - Use Spatial Data in SuperGIS Desktop: Analyze the density of people who receive education
Taiwan is a small island with huge number of people, so the population density is received great attention. Until Oct. in 2011, the population density of Taipei city reaches 9,724.57, which is the top one rank, and is two times the population density of Chi-yi city, which is the second place. In this exercise we try to display the administration areas of Taipei city with the number of people who take university education in Taipei city through the Density tool.
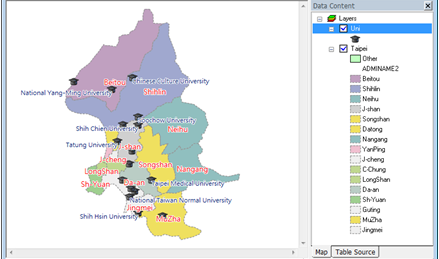
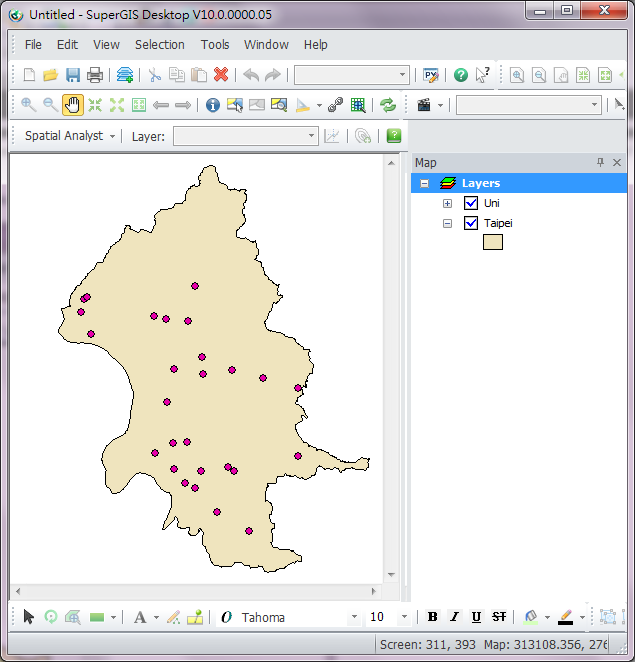
1.Load the Taipei city layer(Taipei.shp) and school layer(Uni.shp).
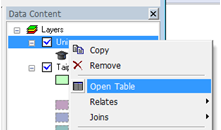
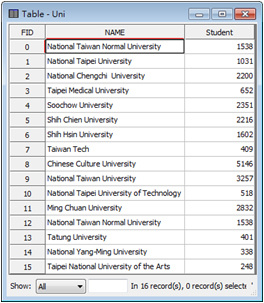
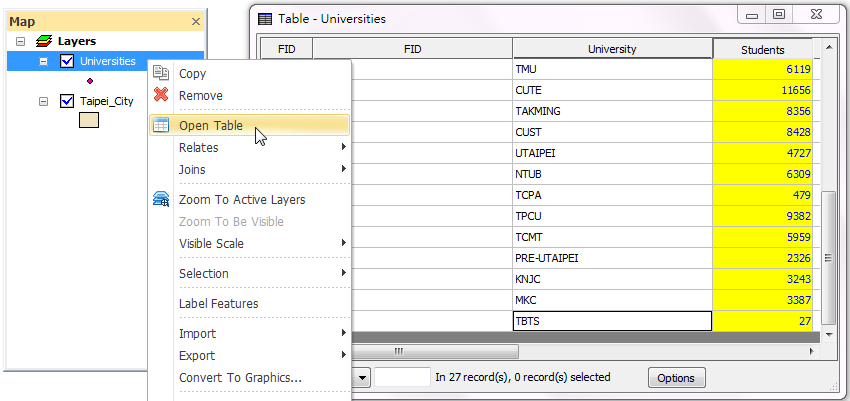
2.Right-click the school layer and open the attribute table. You'll see the number of students field (Student) for later use.
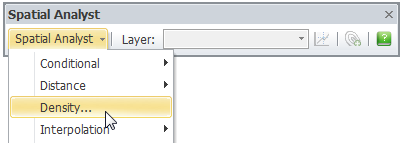
3.Select "Spatial Analyst">"Density."
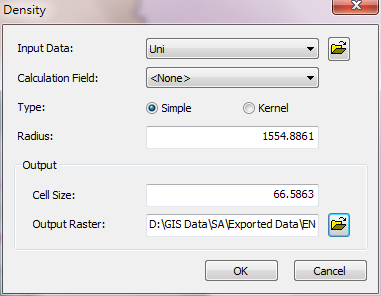
4.Density window shows up and follow the steps as below:
i.Select university layer(Uni) in "Input Data."
ii.Select the number of students field (Student) in "Calculation Field."
iii.Select "Kernel" for density analysis.
iv.Set radius as 2500 meters.
v.You can change the sell size, but in this exercise, we will keep the setting.
vi.Select the output path and enter the file name.
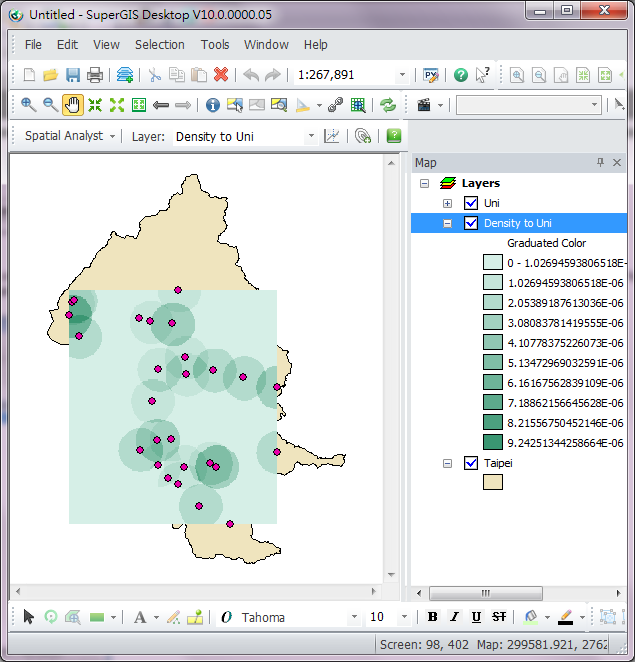
5.The figure below shows the density analysis result of the universities in Taipei city with Kernel. Through the analysis we find that the density of number of student are higher where the schools are dense. While in nearby locations where no data of number of students is found will progressively decrease, causing the gradient effect.
©2016 Supergeo Technologies Inc. All rights reserved.