
Density
Two ways to calculate density analysis, Simple and Kernel.
Simple
With the center of each cell as basis, Simple calculates with a radius to find out the sources which are covered in the searching range(point or polyline). Then, multiply the corresponding weight, get the sum and divide the sum by the searching area. The obtained result value will be the cell value.
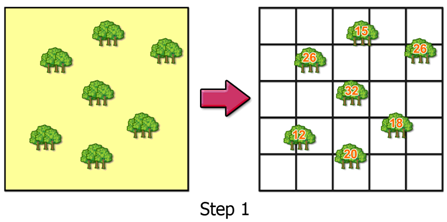
See the figure of Step 1, after surveying, the tree quantities in different forest spaces are obtained. Each survey location is represented by one point feature(the tree symbol). Each point is given a value(weight), the value might represent the quantity of trees. After that, get the sum of all the point data (weight is calculated) within the searching range based on the related setting parameters (searching radius, cell size). The density value of the cell is obtained.
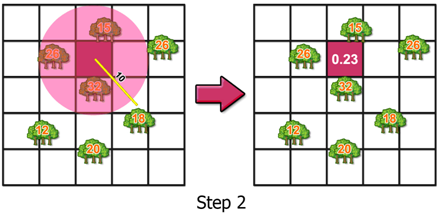
See the figure of Step 2, to get the density value of cell, we need to set the searching radius of the cell first. Assumed the radius is 10, there are three point within the radius range, they are respective 15, 26 and 32. As a result, the density value of the cell is (15+26+32)/(10*10*3.14)=0.23
|
Each line is represented by a value(weight); the value means the level of influence. Then, start to calculate the density value of each cell according to the related parameters (searching radius, cell size). When analyzing line density, the system will multiply the length of the line found within the searching radius to its weight, get the sum and divided by area to get the density value of the cell. It only calculates the lines located in the searching range only; if no line is located in the range, the result will be NoData.
|
Kernel
Kernel disperses the known quantity of points or lines from the center and gets the accumulative sum of intersections on the surface.
Conceptually, each point can be considered being covered by a smoothly curved surface above it; the position of the point is of highest value, and the value grows smaller as the distance to the point increases. Sets the position whose distance to the point is equal to the searching radius 0. |
Conceptually, each line can be considered being covered by a smoothly curved surface above it; the position of the line is of highest value, and the value grows smaller as the distance to the line increases. Sets the position whose distance to the line is equal to the searching radius 0.
The two methods has different visual effect that the successive surface gained by Kernel is smoother than Simple. But the larger searching radius contributes the more generalized and smoother output density raster ; the smaller searching radius contributes the more detailed output density raster . |
Description of Parameters
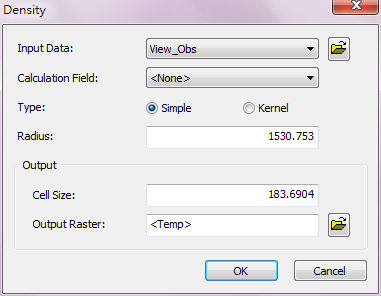
Item |
Description |
Data Type |
Input Data |
The data to be performed Density analysis. |
Feature layer (point, line) |
Calculation Field |
The weight or value to calculate. |
Attribute field |
Type |
Select the analysis type. |
Analysis options |
Radius |
The searching radius in analysis. |
Integer / Floating point |
Cell Size |
The cell size of the output raster. |
Integer / Floating point |
Output Raster |
The filename and storage path of the output raster. |
Raster layer |
©2016 Supergeo Technologies Inc. All rights reserved.