
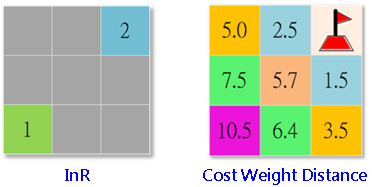
Cost Weighted Distance
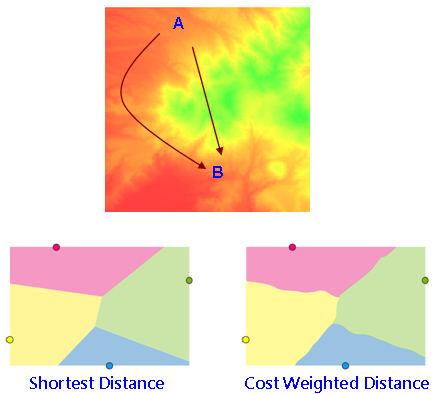
Cost weighted distance analysis is to find out the accumulative cost of each cell to its nearest source. Contrary to Euclidean distance, the cost weighted distance differs due to different cost basis (energy consumed, terrain, land type, security, etc.) Because under some situation, the straight line distance might not be the best route to go. See the figure below. If a man is getting to B from A, the shortest distance from A to B (the straight line distance) will take to climb over a mountain, which takes 3 hours. However, if the man walks around the mountain, though the total distance is longer than climbing over it, but the time spent is less by one and half hour. So if time is the important factor, walking around the mountain will be a better choice. So, in cost weighted distance analysis, the accumulative cost includes not only the shortest distance from cell to the nearest source but also other costs, like time. The cost will be given with different weight value based on the importance level.
Before performing cost weighted distance analysis, please select the source layer and cost layer, and make sure the two layers have the identical position and size. If not, they will not be processed.
When performing cost weighted analysis, a source layer and a cost layer are required. The source layer could be a raster or a feature class. For a raster, each cell has a valid value. If a cell is NoData, it will not be calculated during the analysis process, so its output call value will retain NoData. For a feature class, it will be transformed to raster layer in the process. The cost layer should be a raster; the unit can be of any types, such as expense cost, time or consumed energy (cost in 0 or negative is invalid).
Cost weighted distance analysis can be employed to analyze the geographical movement, such as the immigration of animal, consumer traveling behavior, etc. Besides, the analysis is able to calculate the least cost for designing the network of new roads or pipes.
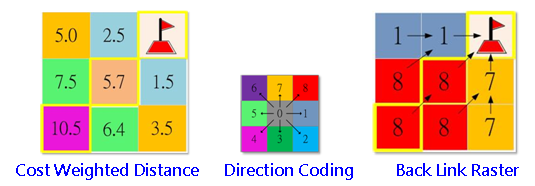
Back Link Raster
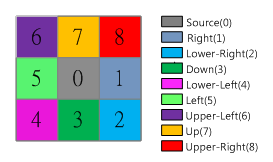
The output is a road map, recording the least accumulative cost path to the nearest source from each cell location. It contains the values from 0 to 8, describing the direction. Or it defines the next cell to connect on the least accumulative cost path to the closest source. To describe the direction, if the path direction is rightward, the right side of the raster will be 1, the lower right side will be 2, the value ascends in clockwise direction.
Allocation
Calculates the nearest source for each cell based on the least accumulative cost over a cost surface. The concept is familiar to Allocation of Straight line analysis, the difference lies that it calculates the least accumulative cost.
Description of Parameters
Item |
Description |
Data Type |
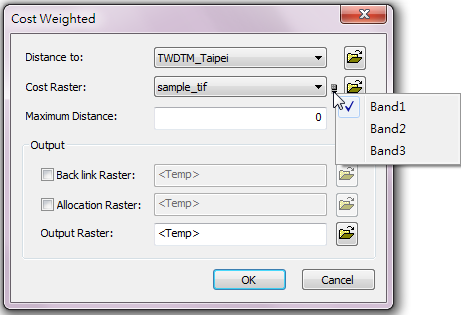
Distance to |
The raster data to be performed distance analysis. |
Raster layer |
Cost Raster |
The least cost path. Users can click the |
Raster layer |
Maximum Distance |
To define the maximum distance, if the value exceeds this value, it will be assigned NoData. The default is the maximum distance of the input raster. |
Raster layer /constant |
Back link Raster |
Output the back link raster and set filename and storage path. |
Raster layer |
Allocation Raster |
The allocation output raster. Set the filename and storage path for the output file. |
Raster layer |
Output Raster |
The filename and storage path of the output raster. |
Raster layer |
©2016 Supergeo Technologies Inc. All rights reserved.