
Cell Statistics
Cell Statistics is suitable for regional statistics. Each cell value of the output raster will be considered as a function relative to the cell value of the original raster. Thus, with the Cell Statistics analyst, a statistic value can be obtained from multiple input rasters. For instance, you can use this tool to analyze a phenomenon in some period of time, like the average output of rice in some region in the latest ten years, or the rainfall in recent years.
In SuperGIS Spatial Analyst 3, ten overlay statistics items are provided, Majority, Minority, Maximum, Mean, Minimum, Median, Range, Standard Deviation, Sum, Variety. The system calculates the input rasters in a way of cell-by-cell; then, transfers the calculation result to the corresponding cell location in the output raster.
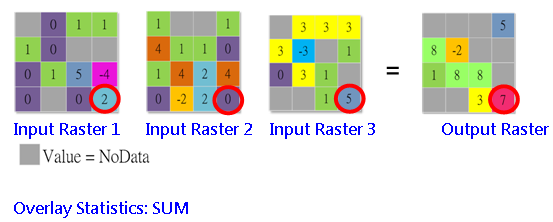
Please see the figure below:
1. Perform statistics to each cell of the input rasters(Sum). Example: at the lower right corner, 2(IR 1)+0(IR 2)+5(IR 3)=7 (OR)
2. If any one input cell has value NoData, that location will be assigned NoData on the output.
Description of Parameters
Item |
Description |
Data Type |
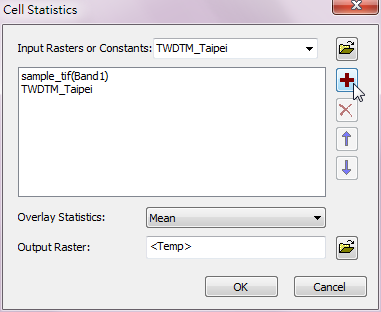
Input Raster or Constants |
Input raster or constants to perform Cell Statistics (multi-selection). |
Raster data/Constant |
Overlay Statistics |
The statistics methods •Minimum: Calculate the input minimum. •Maximum: Calculate the input maximum. •Range:The difference of the input maximum and minimum. •Sum: get the sum of the input. •Mean: Calculate the mean of the input. •Standard Deviation: Calculate the standard deviation of the input. •Variety: Calculate the variety of the input. •Majority: Calculate the majority of the input. •Minority: Calculate the minority of the input. •Median: Calculate the median of the input. |
Analysis options |
Output Raster |
The filename and storage path of output raster. |
Raster data |
©2016 Supergeo Technologies Inc. All rights reserved.