
Creating a Graph
Creating a graph depends on how users would like to display the attributes of the layer. Therefore, before creating a graph, users have to understand the data so that they will be able to choose the appropriate graph type to analyze their data. For example, line graphs are suitable for the continuous data related to time; pie charts are suitable for the statistics data of sum or ratio. A good chart can show the trend in values, distribution, and the relationship between data. SuperGIS Desktop Graph Add-on can help you to create graph of all of the attributes of a layer or only some specific ones. The steps to create a graph are:
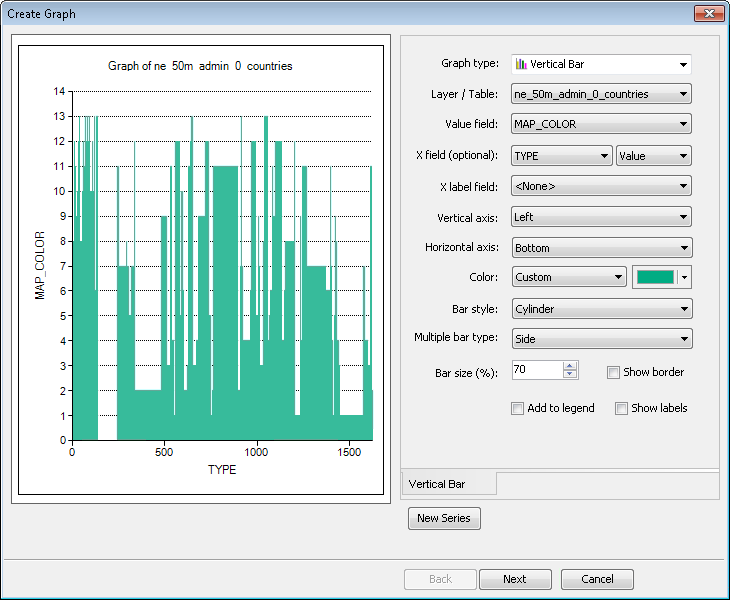
1.Open Create Graph
2.In Graph Type, choose the type you would like to create.
3.In Layer / Table, choose the source layer.
4.In Y Field or Value Field, choose a field of the source layer as Y axis.
5.In X Label Field, choose a field of the source layer as the item shown on X axis.
6.In Vertical axis select the position of vertical axis.
7.In Horizontal axis select the position of horizontal axis.
8.In Color, choose the color you want the items in graph to be displayed.
9.Set the appended field for the graph type you choose. For example, if you choose Vertical Bar, you can set Multiple Bar Type.
10.Set whether to add a new graph (New Series) to create a mixed or overlay graph.
11.After the graph settings are finished, click Next.
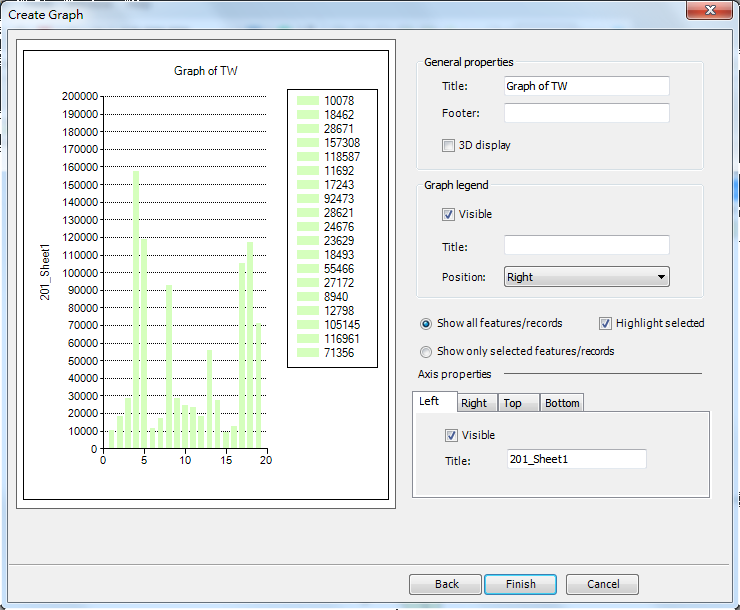
12.In Appearance, you can set Show All Features/Records or Show Only Selected Features/Records.
13.In General Graph Properties and Graph Legend, set the title, footer, position, etc.
14.Set Axis Properties.
15.Click Finish, and the graph is created.
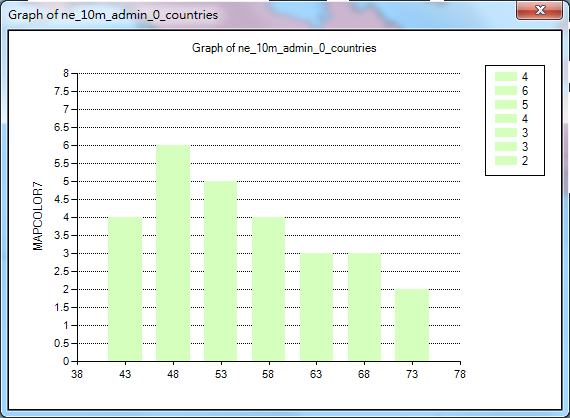
NOTE: There is no fixed principle of graph display. You only need to choose the type which can convey the information of the map.
©2015 Supergeo Technologies Inc. All rights reserved.