
Creating Graphs of Selected Features
With Graph, you can produce diverse graphs based on your current spatial data. SuperGIS Desktop Graph Add-on provides two ways to create graphs, Show All Records or Show Only Selected Records. Thus, if users want to graph the selected features, they only need to use the tools to select features or attributes. Consequently, users can create graphs easily.
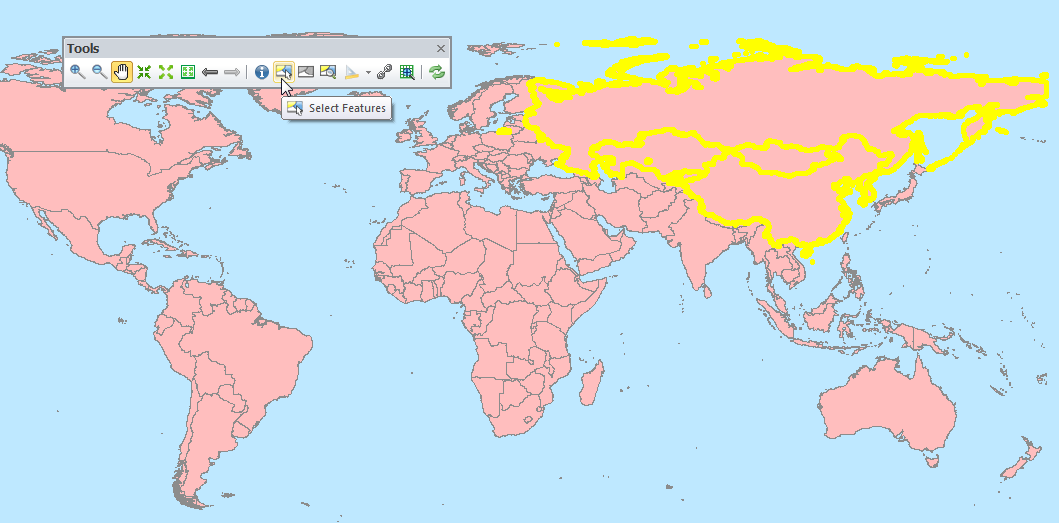
•Use Select Features tool to select features and create graphs
In SuperGIS Desktop, one of the methods to select features is to select by Select Features tool. You can drag a rectangle to select the features within an area or some specific features. As the features are selected, you can use the Graph tools to plot the features.
1.Click Select Features tool on Tools toolbar.
2.Drag a rectangle on the map to select the features.
3.The selected features are displayed in the selection symbols on the map.
4. Open Create Graph.
5. In Graph Type window, complete the settings and click Next.
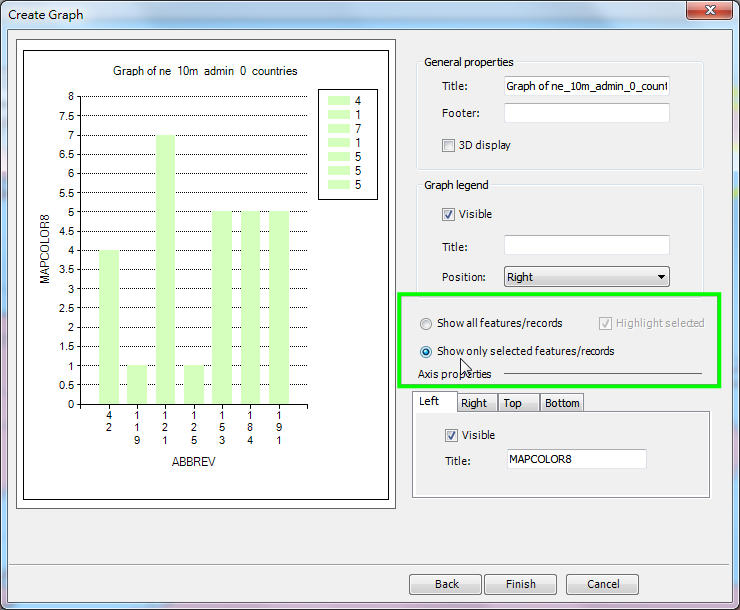
6. In Appearance window, choose Show Only Selected Features/Records, and click Next.
7. The graph of selected features appears.
•Select features in Attribute Table and create a graph
You are allowed to select one or multiple records of attribute data in attribute table. The selected record(s) will be displayed in selection color, the default is yellow. Meanwhile, the corresponding features will be selected on the map as well. When the features are selected, you can apply Graph tools to graph the selected features.
1. Right-click the layer whose features you want to select, and choose Open Table.
2. In attribute table, choose the record(s) you need. The selected record(s) will be displayed in selection colors.
3. The corresponding features will be displayed in the selection symbols on the map as well.

4. Open Create Graph.
5. In Graph Type, finish the settings and click Next.
6. In Appearance tab, choose Show Only Selected Records. And click Next.
7. The graph of selected features appears.
NOTE: When selecting features, you can hold Shift key on keyboard to do Range-Select or hold Ctrl key to do Multi-Select.
©2015 Supergeo Technologies Inc. All rights reserved.