
Setting Map Grid
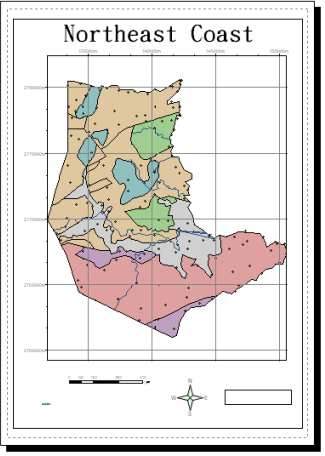
With the map grid, users can label the map coordinates on the Layout View according to X and Y axis in different areas. Firstly, open the "Element Properties" dialog box, check "Show Grid Lines" and click "OK" to show the grid lines in the Layout View.
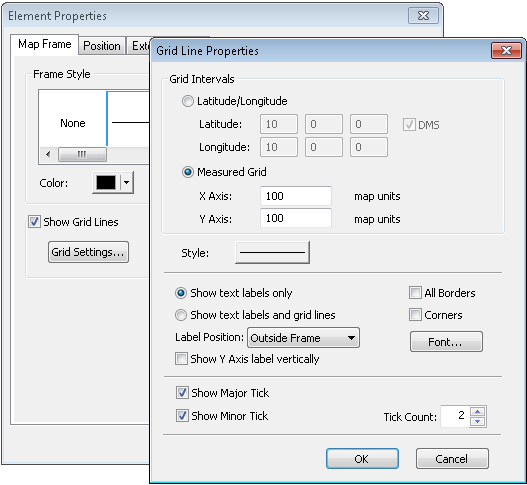
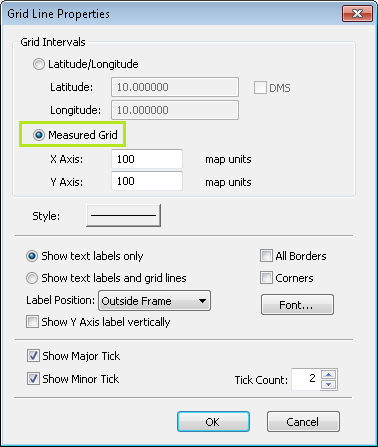
To set advanced grid line properties, click "Grid Settings" in "Element Properties" dialog box. Firstly, choose the type for grids, Latitude/Longitude or Measured Grid. If you choose the former, you can set degree, minute, second for longitude and latitude respectively. Cancelling tick of “DMS” enables users to use decimal to set longitude and latitude. If you choose the latter, you can set the size for the grid. Furthermore, if the coordinate system of your map is projected coordinate system, you can still use Latitude/Longitude. The system can transfer the coordinate system to the geographic coordinate system. What should be noted is that if the map is not defined with coordinate system, you cannot use Latitude/Longitude.
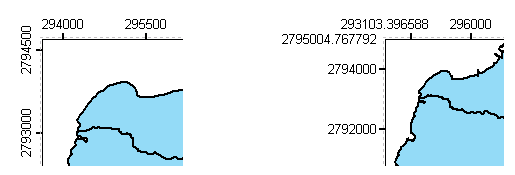
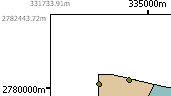
Moreover, you can click "Style" button to set the color, style of the grid line. In addition, the label of coordinates can choose "Show text labels only" or "Show text tables and grid lines." The former shows the text labels of coordinates only without the grid lines, while the later shows both the text labels of coordinates and the grid lines. You can also set the label position to be outside or inside of the frame. While “Show Y Axis label vertically” is selected, the text label on Y Axis will be 90 degree rotated and then displayed vertically, shown as picture left. Moreover, you can choose whether to use "All Borders" and "Corners." The figure right is the result of selecting Show coordinates at corners.

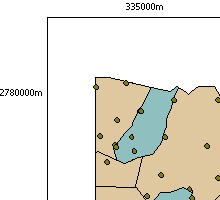
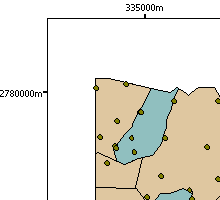
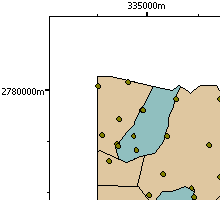
In the "Element Properties" dialog box you can also set whether to "Show Major Tick" and "Show Minor Tick." "Tick Count" refers to the number of tick contained in a box. Let's take the three figures below for illustration, the figure in the left is the result of not checking "Show Major Tick" and "Show Minor Tick", so it shows text labels and unit only. The figure in the middle is the result of checking "Show Major Tick" only so the text labels, unit and major tick are displayed. The figure in the right is the result of checking both "Show Major Tick" and "Show Minor Tick" and "Tick Count" is 2 so it displays text labels, unit and major ticks, besides, between the major ticks two ticks are placed to represent the minor ticks.
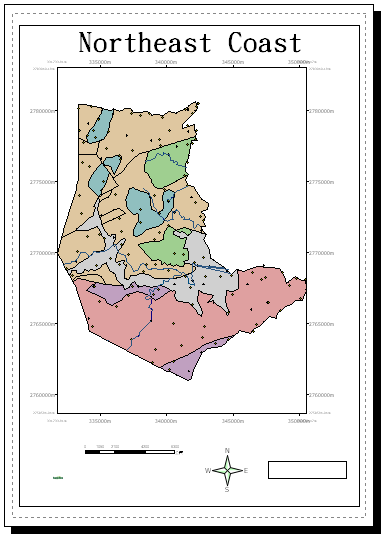
Due to the text labels of map grid is displayed on the top and left side of the map by default, if you also want to label on the right side and bottom, click Show Both at the bottom in the "Grid Line Properties" dialog box and the grid line labels display as below.
Click the "Font" button at the lower right corner in "Grid Line Properties" dialog box to show the Font dialog box. Here you can set the style, size and color.
©2015 Supergeo Technologies Inc. All rights reserved.