
Histogram
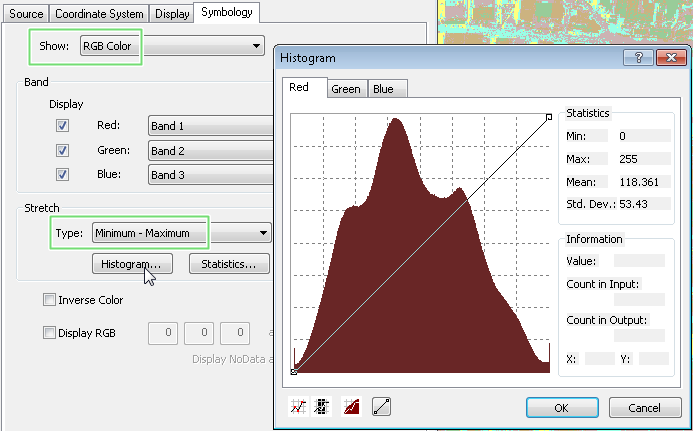
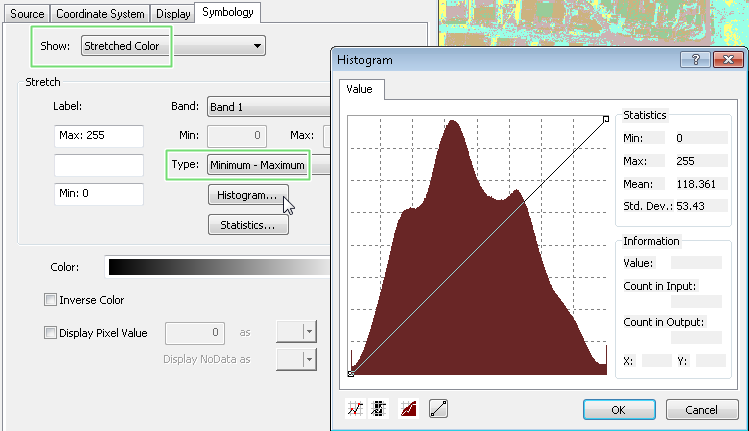
Click "Histogram" button in "Image" tab in Layer Properties window, and the "Histogram" window appears. The window shows the related data of cells of the raster layer. No matter you choose "RGB Color" and "Stretched color" as the show type of the raster layer, the "Histogram" window can be opened when minimum-maximum, standard deviation, and custom are selected as stretch method.
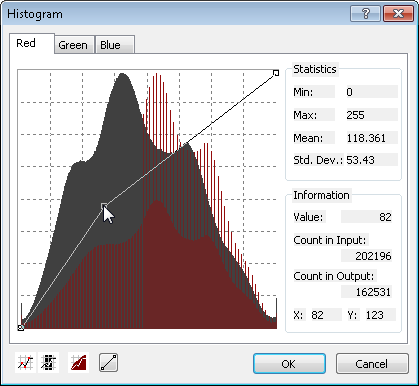
The lower-left graph is a histogram of multi-band image; the lower-right graph is the histogram of single-band image. For multi-band images, the histogram window contains 3 tabs to present each band, while the histogram of single-band image displays the distribution of the color of the image. "Statistics" field on the right side records the data of the cells of the band, such as min, max, average, standard deviation. Meanwhile, you can move the mouse cursor around the histogram to check the value and the count of the value in "Input" and "Output" in "Information" field. The X axis refers to the color of the input image, so the range is from 0 to 255. The Y axis is the color of the output image, so the range is also from 0 to 255.
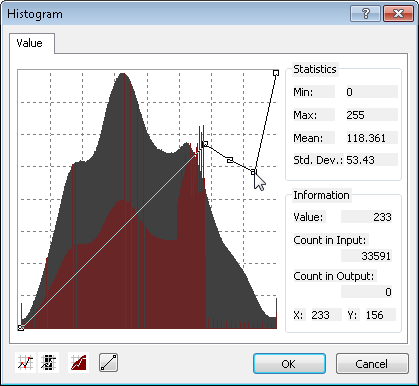
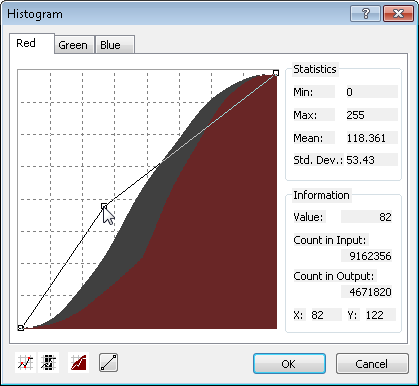
Additionally, you can click ![]() on "Histogram" window to add breakpoints to adjust the distribution of colors of the image. The grey part in the histogram is the value distribution of the input image, while the output image is displayed in other colors (like dark red, green, blue). In the following graph, due to the histogram of single-band image, the distribution of the output image is displayed as dark red. Meanwhile, you can move the mouse cursor around the histogram to check the count of the cells in the input image and the count of the value which is changed by the settings of the output image. In the lower-left graph, the current cursor position shows that the color 190 in input image posses 0 cell but possess 831 cells in output image. If you would like to know the new value generated by adjusting the line, you can move the mouse cursor to the X coordinate of the value in the input image and move the cursor to the line, the Y coordinate in lower-right corner of the window indicates the new value generated by adjusting the line. Take the lower-right graph for example. The original color is 158, but the new value generated by adjusting the line becomes 236. If you want to reset the image, you can click
on "Histogram" window to add breakpoints to adjust the distribution of colors of the image. The grey part in the histogram is the value distribution of the input image, while the output image is displayed in other colors (like dark red, green, blue). In the following graph, due to the histogram of single-band image, the distribution of the output image is displayed as dark red. Meanwhile, you can move the mouse cursor around the histogram to check the count of the cells in the input image and the count of the value which is changed by the settings of the output image. In the lower-left graph, the current cursor position shows that the color 190 in input image posses 0 cell but possess 831 cells in output image. If you would like to know the new value generated by adjusting the line, you can move the mouse cursor to the X coordinate of the value in the input image and move the cursor to the line, the Y coordinate in lower-right corner of the window indicates the new value generated by adjusting the line. Take the lower-right graph for example. The original color is 158, but the new value generated by adjusting the line becomes 236. If you want to reset the image, you can click ![]() , the breakpoints on the line will be removed. And the image will be reset as well.
, the breakpoints on the line will be removed. And the image will be reset as well.
Moreover, you can click ![]() to view the total count of cells in the range you drag. In this sample, the dragged area is between 60 and 106; within the range, there are 58634 cells in total.
to view the total count of cells in the range you drag. In this sample, the dragged area is between 60 and 106; within the range, there are 58634 cells in total.
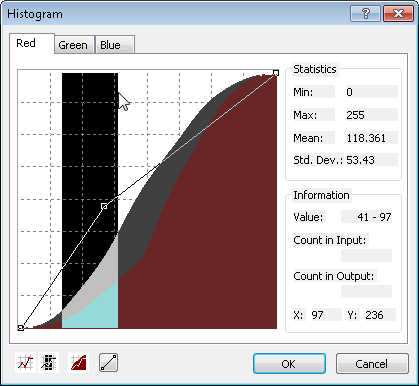
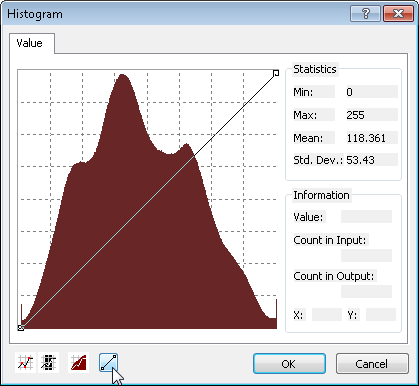
Histograms enable users not only to view the count of some color in input and output image(like the lower left window) but also click ![]() to view the cumulative data of the colors (like the lower-right graph).
to view the cumulative data of the colors (like the lower-right graph).
You can click "OK" to finish setting or viewing and close the histogram window. Back to Layer Properties window, you can click "OK" and finish all the settings.
©2015 Supergeo Technologies Inc. All rights reserved.