
RGB Color
If your image is multiband, you can choose to display with "RGB Color." Please choose "RGB Color" in "Show" Type in "Symbology" tab.
.png)
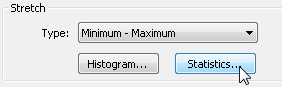
After "RGB Color" is chosen, in "Band", you can tick the band, red, green, and blue to decide whether to display. Meanwhile, you can set red, green, blue to be displayed in which band. Below "Band", there is a "Type" drop-down list in "Stretch", including none, minimum-maximum, histogram equalized, standard deviation, and custom.
None: If you cannot make the image stretched, you can set the maximum and minimum to decide the range of stretch. The range of pixel of an 8-bit image file is between 0~255, and that of 16-bit one is between 0~65535.
Minimum-maximum: The system will stretch the color of the original layer via interpolation to the range you set.
Histogram Equalized: It's an image contrast enforcement technology by hiding the subtle part of an image to the light and dark ends of the spectrum. It can strengthen the contrasting effect.
Standard Deviation: The system calculates the standard deviation of the pixel value of each band automatically. If you set 1 on “n”, the system will add and subtract one standard deviation to the average as the range of the stretched color. If the number of standard deviation you set causes the stretched range over the range of the original pixel, the system will still do stretch according to the original range. Because the system sets the range of stretched color by adding and subtracting n standard deviation. The smaller n is, the smaller the stretched range and the greater color contrast then obtained. If n is bigger, the result will be the contrary.
Custom: You can adjust or add breakpoints to set the range of stretch.
.png)
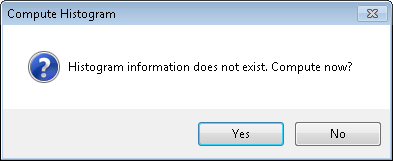
In the five types of stretched color, if users select “Minimum-Maximum”, “Histogram Equalized”, “Standard Deviations” or “Custom” without histogram or statistics information in system, the two message boxes as below will show up respectively. Please click “Yes” to run computing.

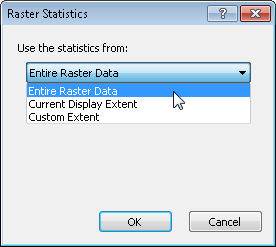
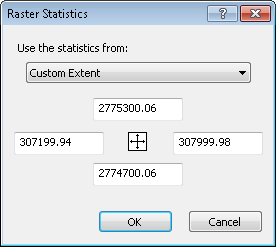
The histogram shows up as the computing is finished. If you click “Statistics”, the Raster Statistics window shows up.The statistics can be calculated from "Entire Raster Data", "Current Display Extent" and "Custom Extent". "Entire Raster Data" refers to directly get the statistics of all image data; "Current Display Extent" will get the statistics of the image data in the current map extent; "Custom" enables users to set the extent by inputting the boundary of the four fields below and the statistics of image data within the defined extent will be obtained.
Moreover, the "Image" tab also provides "Inverse Color" and "Display RGB" functions.
.png)
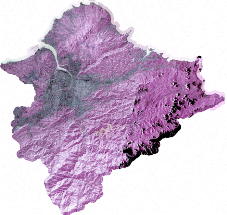
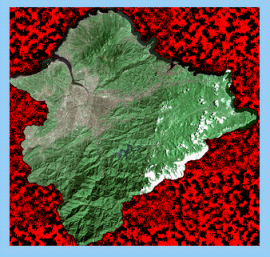
If "Inverse Color" is ticked, the image will be displayed as the inverse colors, like the image below:
|
|
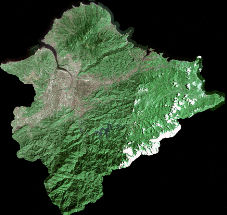
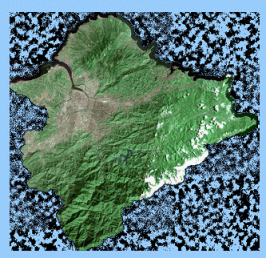
Original image |
Image with inverse color |
If "Display RGB" is ticked, you can define a cell of specific values as No Color or a specific color. As a result, the system will automatically replace the cells of the specific values with No Color or the assigned color. It would be easier for users to edit and view the image. No Color means the cell is transparent so that the color of the lower layer or the map background color will be revealed. Take the lower-left image. We set the cell R:176 G:194 B:199 as dark blue, and the image will be like the lower-right image.
Moreover, if "Display RGB" is chosen, you are also allowed to set "Display NoData as" No Color of a specific color. No Color means the cell is transparent so that the color of the lower layer or the map background color will be revealed. In the lower-left map, the map background color is blue so that the NoData cell will be displayed as blue. If you set "Display NoData as" red, the map will be like the lower-right image.
NOTE: In Symbology tab of raster layer Properties, if you choose RGB Color or Stretched Color in Show and set Stretch Type to those take statistics information (“<None>” and “Minimum-Maximum(user defined)” are not included ), a message box “Statistics information doesn’t exist. Compute now?” shows up if you don’t have. After you click “Yes”, the system will start to compute and save the result as STT file which will be stored in the same folder where such raster layer is located. With the STT file, the system can speed up the related computing.
©2015 Supergeo Technologies Inc. All rights reserved.