
Grid Maker
Grid refers to the basic geometry units for the storage, display and process of geographical data. To create a grid is like to create a layer. Grid is used to divide the continuous geographical space into discrete units in order to record, store and manipulate data. Grids are also useful in mapping and positioning.
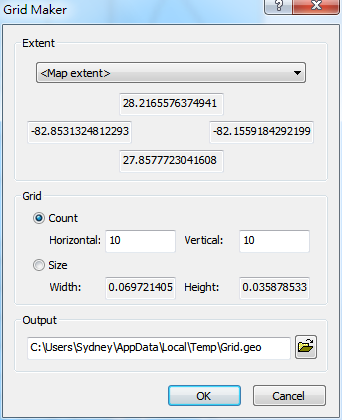
To create a grid, firstly click "Tools" menu > "Grid Maker." Then, "Grid Maker" window is open, and you can choose the extent of the grid to cover “Map extent” or some layer from "Extent" drop-down menu. If you choose “Custom”, you need to type in the values in the text boxes to define the extent. Moreover, you can choose "Count" or "Size" to customize the grids. If you choose "Count", the horizontal and vertical numbers can be set separately, and the system will automatically calculate the width and the height of each cell. If you choose "Size", you can define the width and height of the grid by yourself. At last, as the path for saving the output is confirmed, click "OK."
_new.png)
Then, the system will show “Do you want to add this layer to the map?” window. Click "Yes", and the layer will be added to the current map.
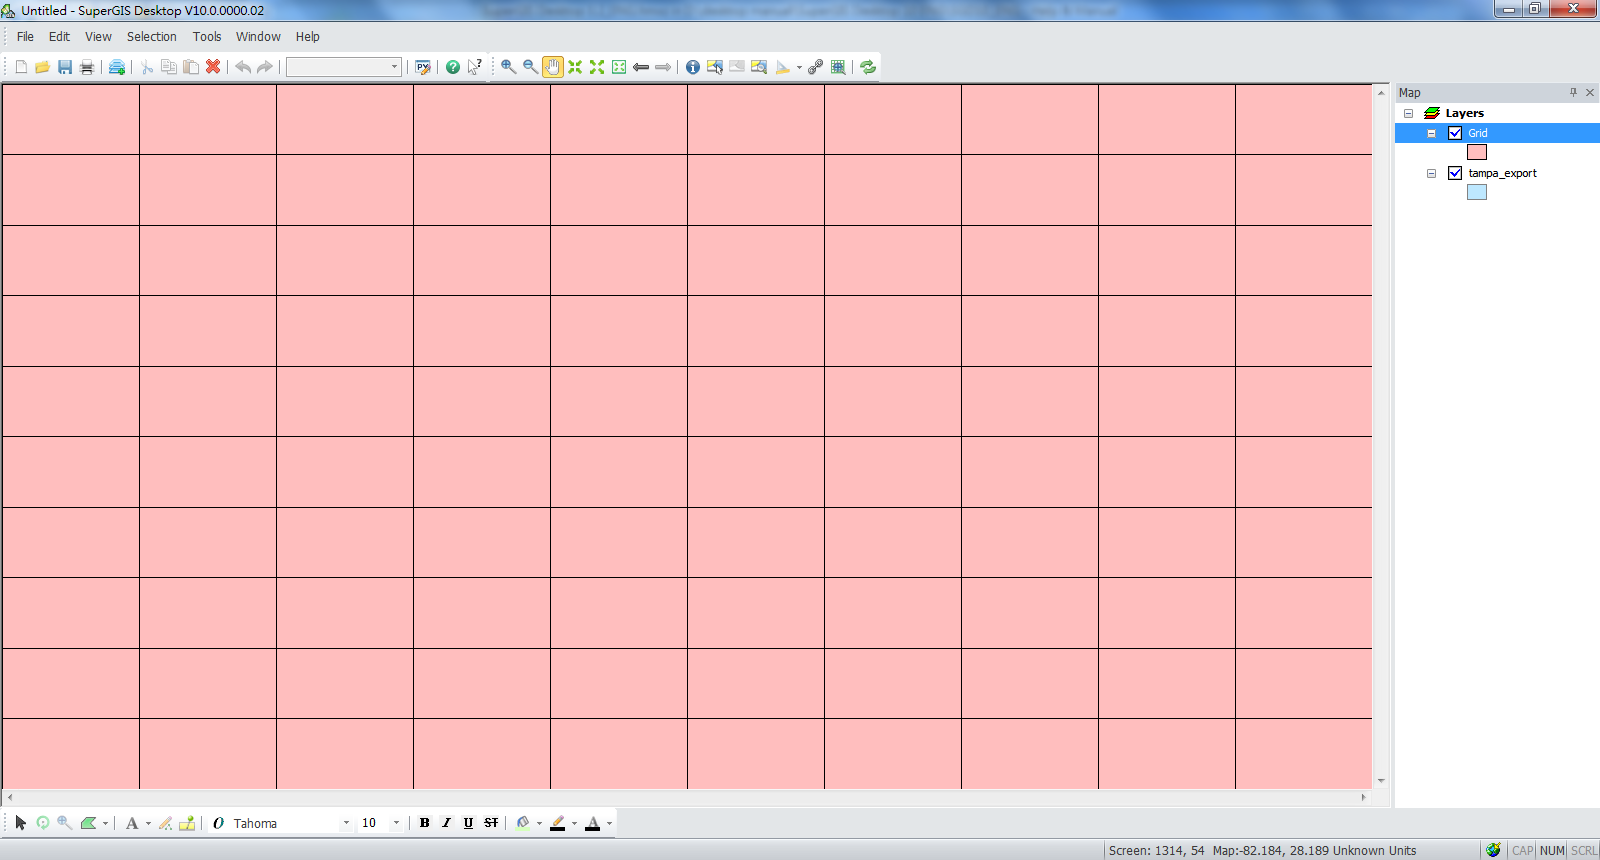
As the grid is added to the map, the grid will be displayed as the top layer so that the other layers will not be displayed. Therefore, you can set the transparency of the grid layer to make the grid and the other layers under the grid display clearly. The color of the grid is chosen by the system randomly, but you can double-click the color block of the grid in Data Content window to set the color you need.
.png)
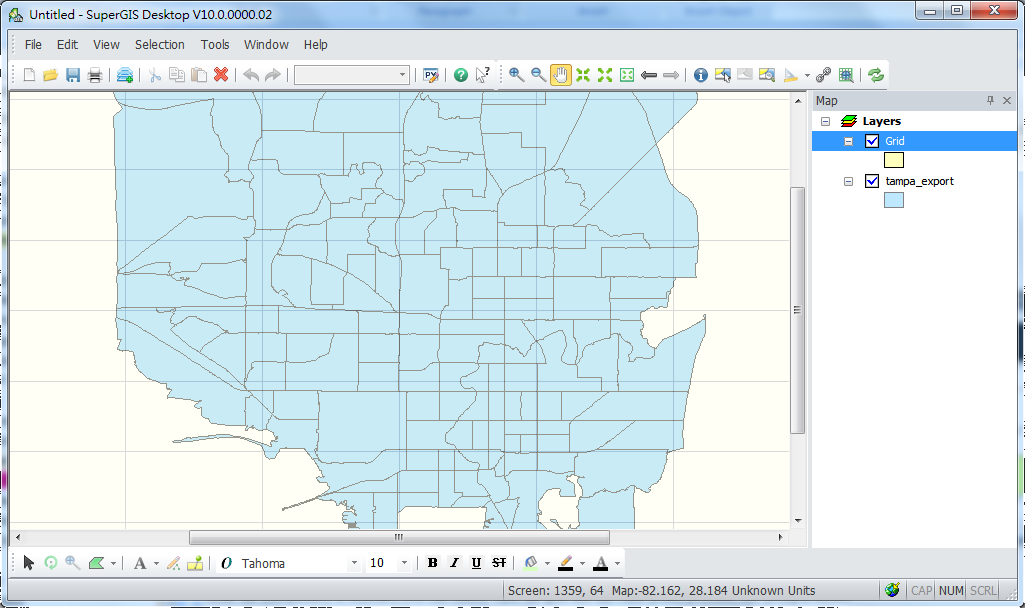
After the transparency is adjusted, you can clearly view the grid and the other point, polyline, and polygon layers.
If you need to view or edit the attribute data of the cells, you can open the attribute table to edit. The way to open the attribute table is the same as the way to open other layers' table. Right-click the name of the grid, and click "Open Table."
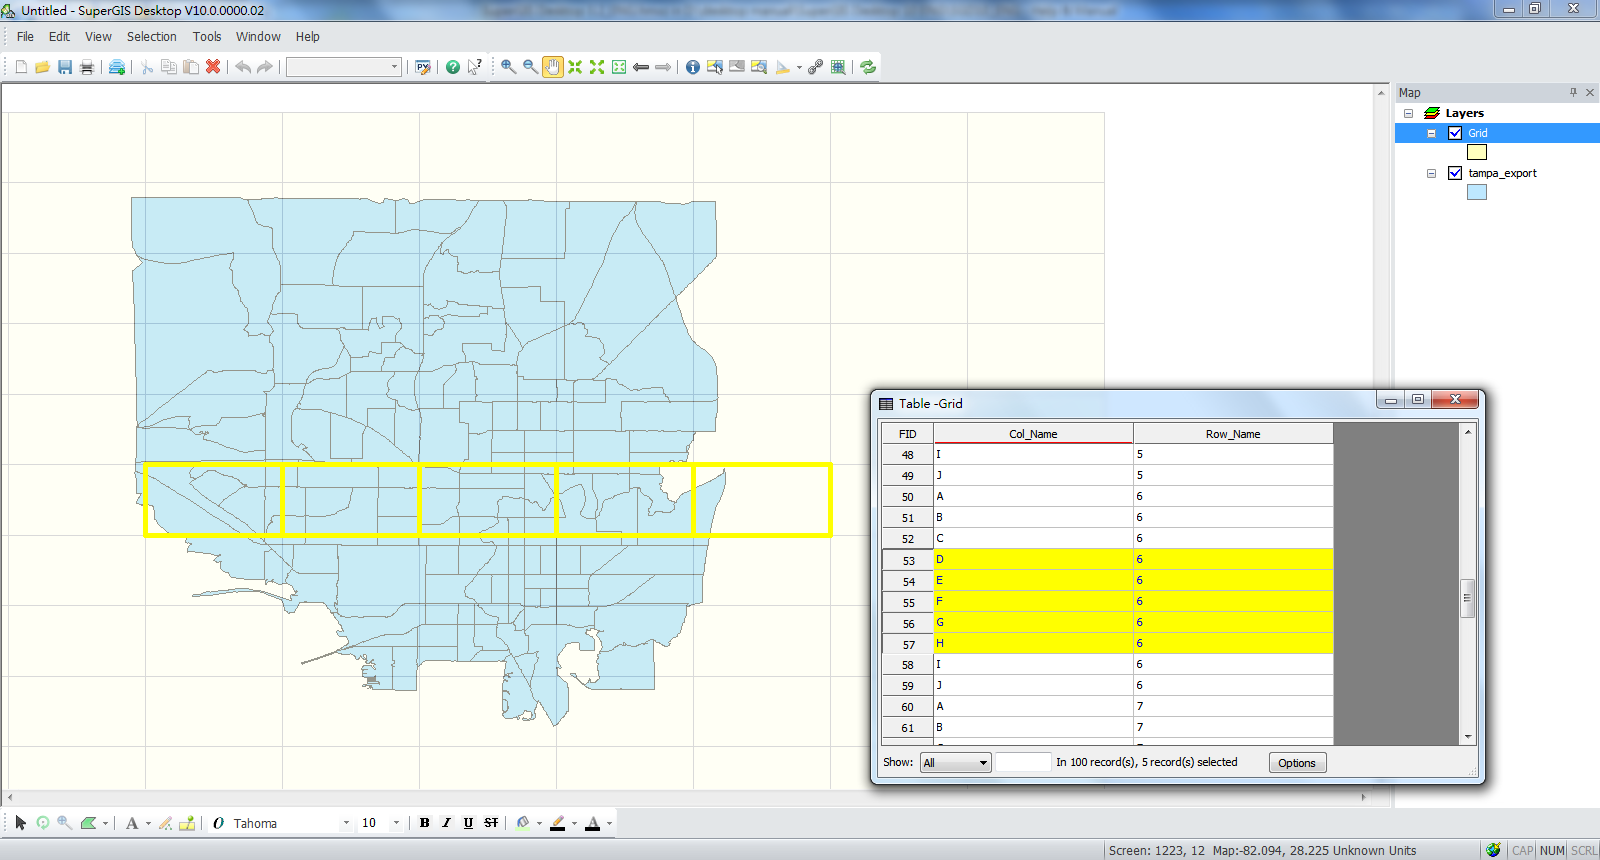
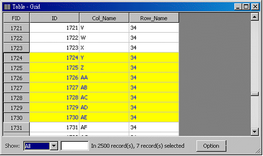
There are three default columns in the grid attribute table, such as ID, Col_Name, and Row_Name. ID is the serial number of the cells. Col_Name is named after the column, from left to right in alphabetic order, and the first column is A. If there are more than 26 columns, the column will be named with 2 letters, like AA, AB, etc. Row_Name is the number of the rows; the first row is numbered 1. In addition, you can select the records in the attribute table, and the corresponding cell will be displayed with the selection symbol on the map window. Similarly, if you select the cells on the map window, their records will be displayed with selection color.
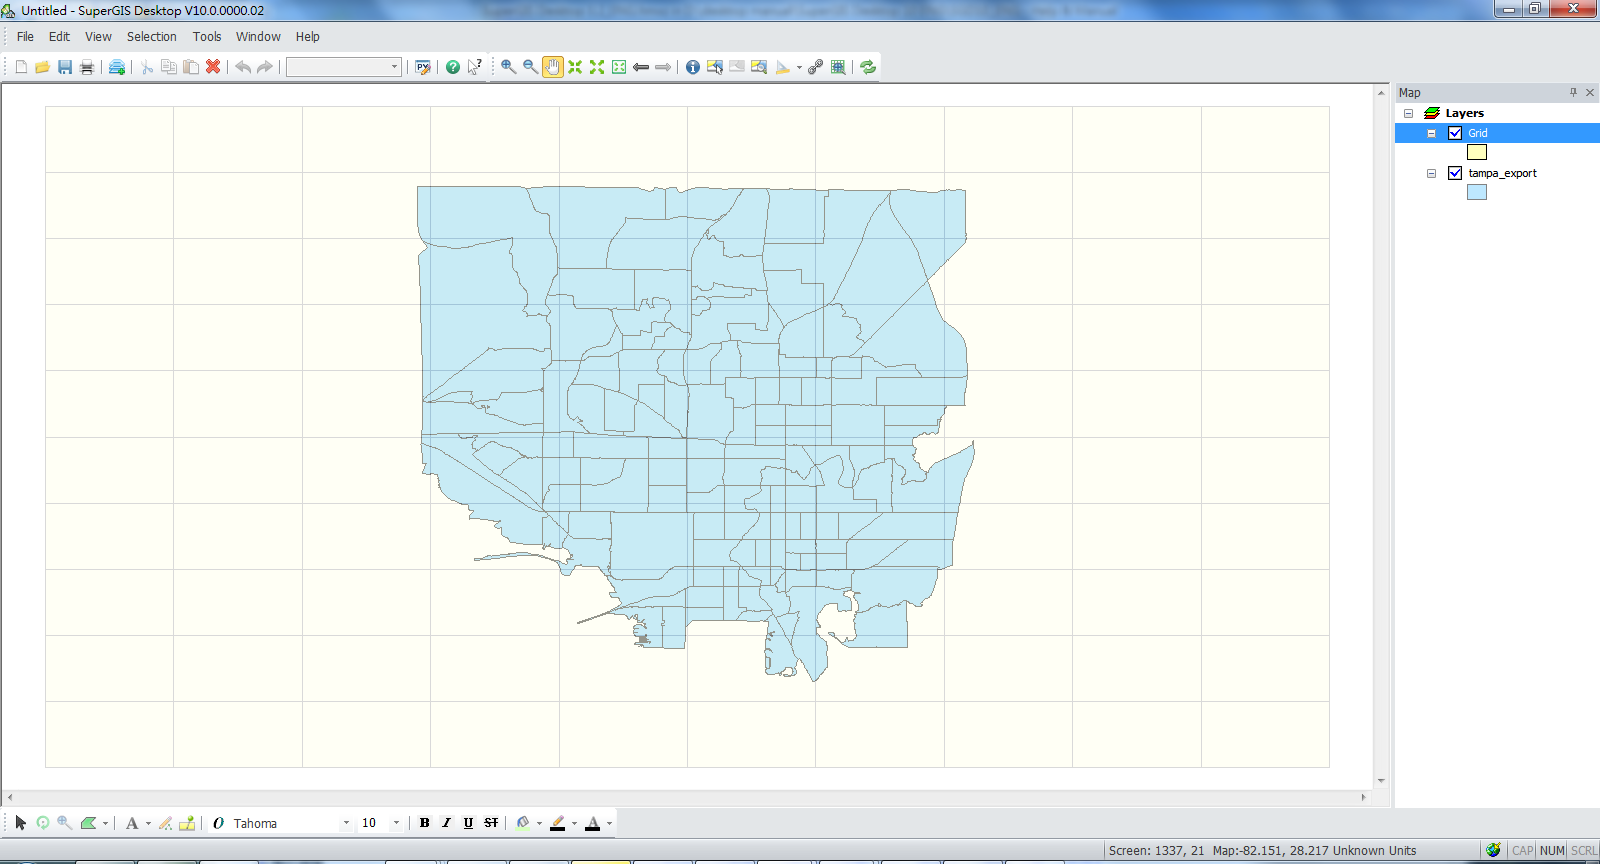
NOTE: If you choose a layer for the extent of the grid, the result will be like the figure below. The grid only covers the extent of the layer.
©2015 Supergeo Technologies Inc. All rights reserved.