
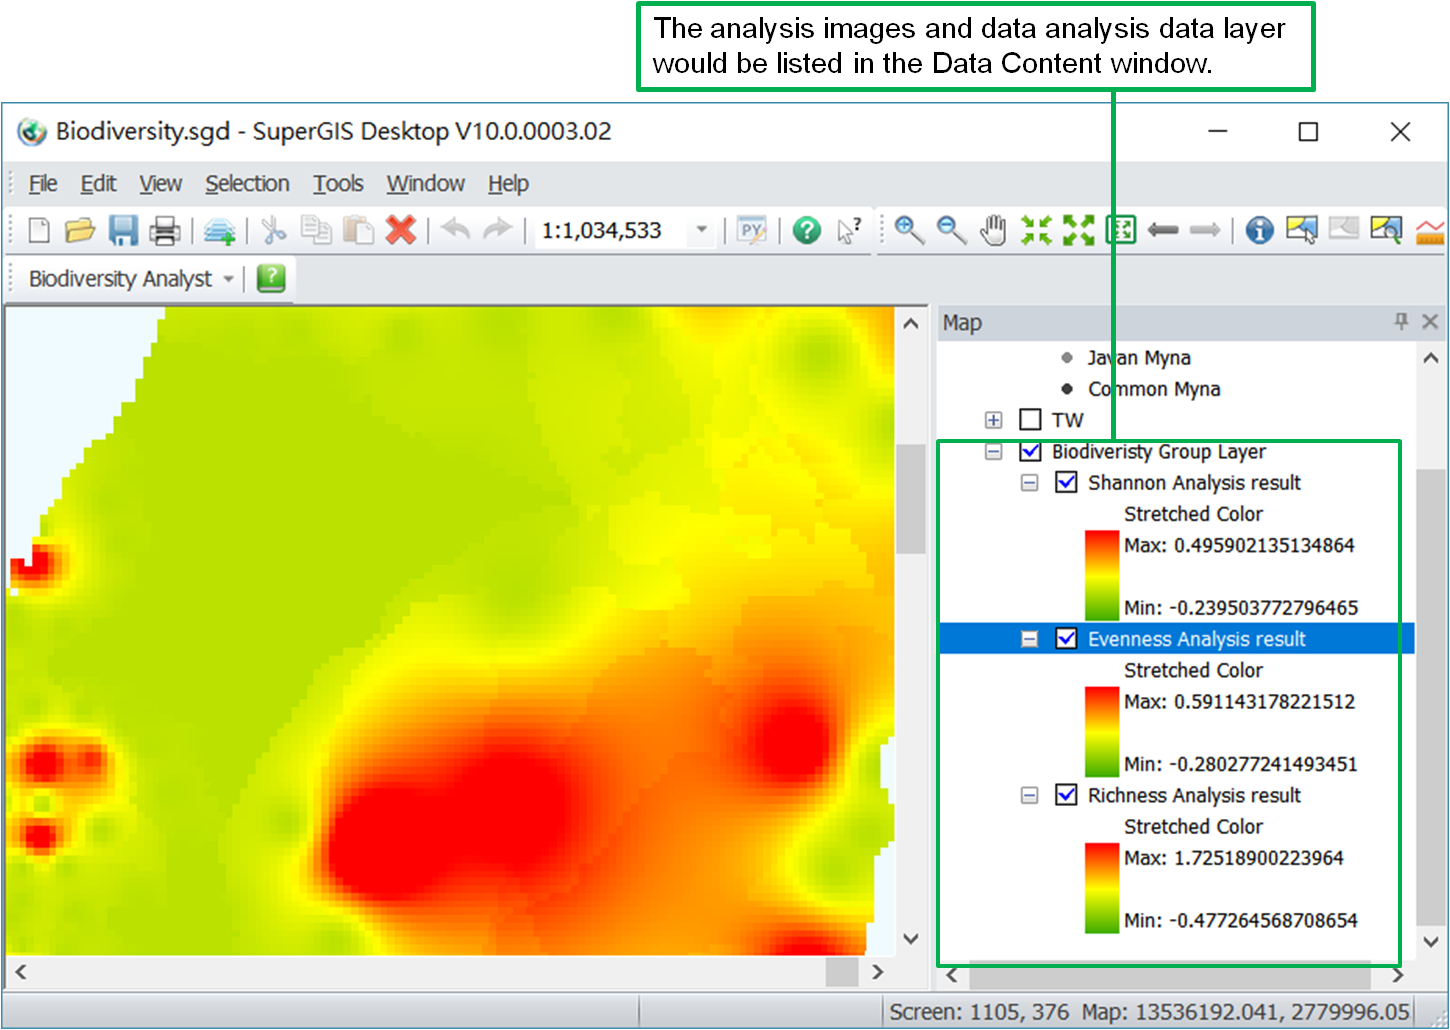
Result of General Analysis
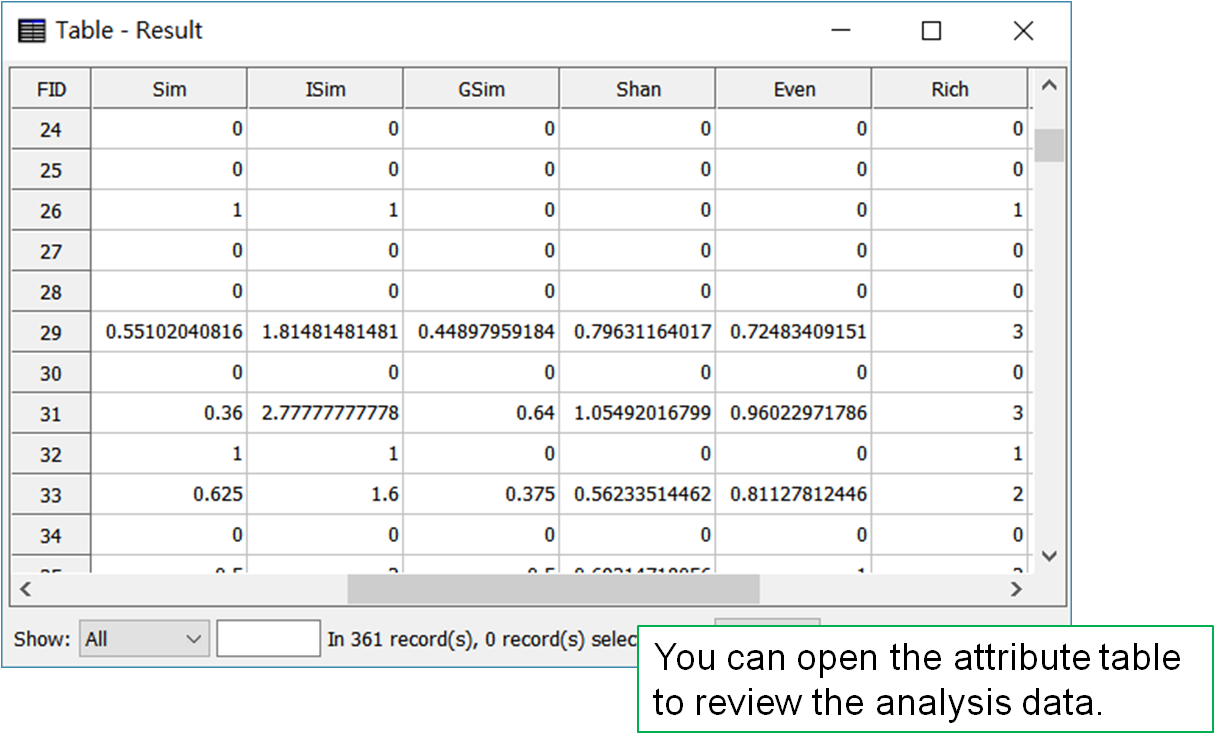
Simpson (D), Simpson (1-D), Simpson (1/D), Shannon-Weiner, and Evenness are the default indices; you can check or uncheck the checkboxes to select the analysis you need. Each index will generate the analysis image as well as one result point or polygon layer correspondingly. You can review the analysis data in the result layer.
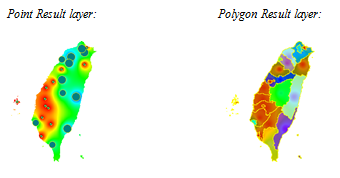
Tip: The Results of analysis
Biodiversity Analyst provides you not only with a point layer of analysis result, but you can also choose to output to a polygon layer. This polygon layer is just like the Result of point layer, which contains the analysis data in the attribute table. With the symbolizing technique, you can demonstrate the result more meaningfully.
© 2017 Supergeo Technologies Inc. All Rights Reserved.