
Diversity Indices
•Shannon
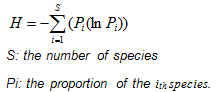
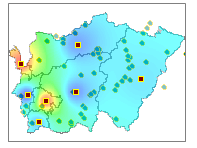
Shannon-Wiener index is a widely used diversity index, which is calculated from the proportion abundance Pi of each species.
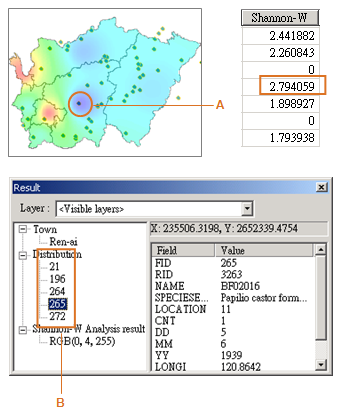
Let's take an analysis result and image above for example. You can see the point in navy blue on the result image, which represents high Shannon index value. Although, it looks like only one blue spot, we can use the Query tool provided by SuperGIS to inquire the point. Then, we can find out that there are five sample data in different species at the very similar location. Thus it leads to high Shannon index value.
We use Shannon index to tell the spatial variance of diversity, and take species richness and evenness into consideration. And for further application, if we fix the variable of species richness, we can use Shannon index as a parameter for calculating the Evenness index, which may be discussed later.
•Simpson (D)
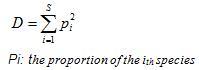
Simpson index (or concentration index) is a diversity index for quantify the species habitat, which is calculated from species proportions. The other Simpson formula shows as below, representing the irreplaceable of sampling:
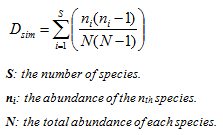
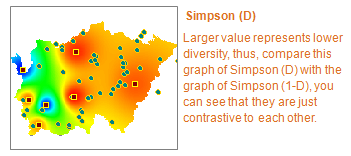
It takes account the number of species as well as the abundance of each species. This index represents the probability that two samples randomly selected from an area would belong to the same species. The range of the index is between 0 and 1; 0 represents infinite diversity and 1 represents no diversity. Because it's neither intuitive nor logical, the Simpson (1-D) and Simpson (1/D) are created to solve the problem.
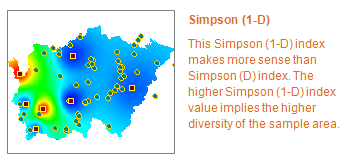
▪Simpson (1-D)- Simpson’s Reciprocal Index
The value of this index also ranges between 0 and 1, but now, the greater the value, the greater the sample diversity. You can compare it with the Simpson index(D), Simpson(1-D) makes it more sense to tell the diversity. If you have two samples from your research area, the index represents the probability that two individuals randomly selected from this area belong to different species.
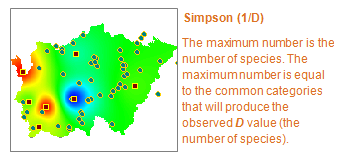
▪Simpson (1/D)- Simpson’s Index of Diversity
The value of this index starts with 1 as the lowest possible figure, which represents a community contains only one species. The higher the value, the greater the diversity is. The maximum value is the number of species in the sample community. The maximum number is equal to the common categories that will produce the observed D value (the number of species), also known as Hill's (1973) N2.
The name 'Simpson's Diversity Index' is very loosely applied and all three related indices described above (Simpson's Index, Simpson's Index of Diversity and Simpson's Reciprocal Index) may quote in different condition depending on author.
•McIntosh’s
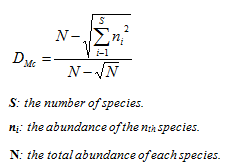
McIntosh's diversity index is not widely used but has quite good sampling properties.
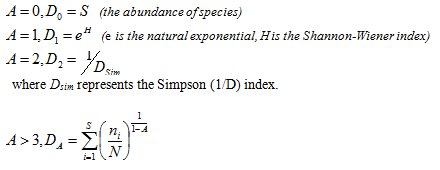
•Hill
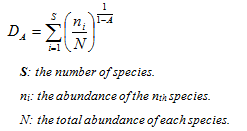
When
© 2017 Supergeo Technologies Inc. All Rights Reserved.