
Analyzing with Grid Sample Layer
You can perform the analysis with a grid layer as Sample Area. With grid Sample data, you can see the biodiversity analysis on an equal distance distribution area.
1.Add a grid layer (polygon layer) or use Grid Maker to create a new grid layer.
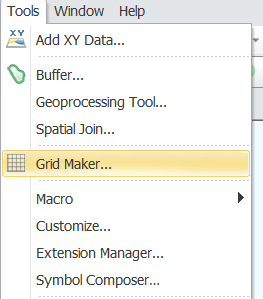
Tip: Grid Maker
You can use the Grid Maker tool to create a new grid layer. There are two ways to create your layer:
•You can input the coordinates of upper-left and lower-right, and specify the grid counts for both horizontal and vertical direction.
•Or you can input the coordinates of the upper-left, specify the grid counts both in horizontal and vertical direction as well as the width and height of grid.
2.Start Biodiversity Analyst by clicking the Biodiversity Analyst button on Biodiversity Analyst toolbar.
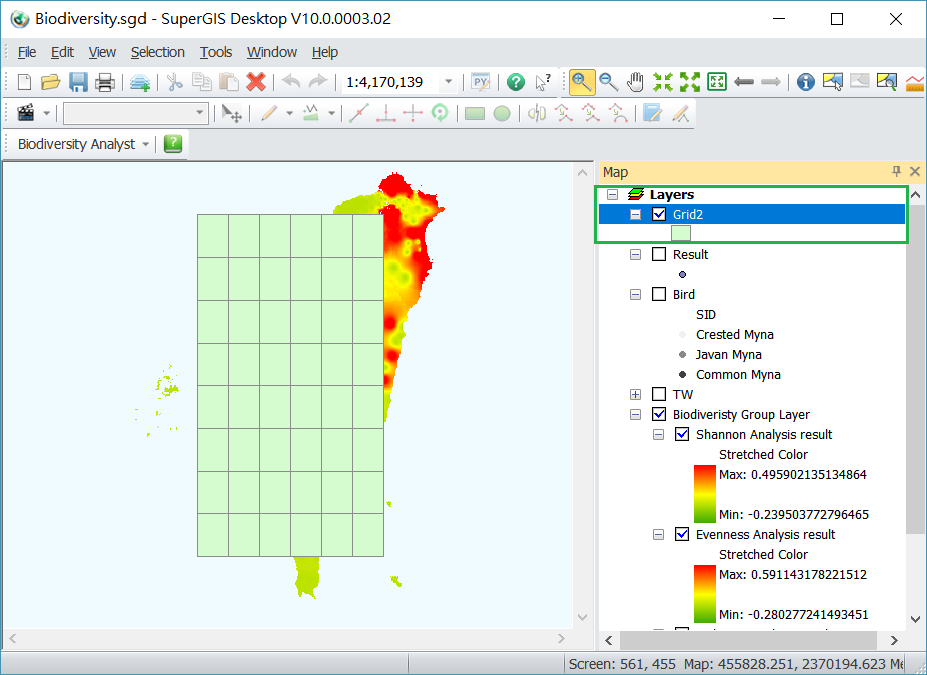
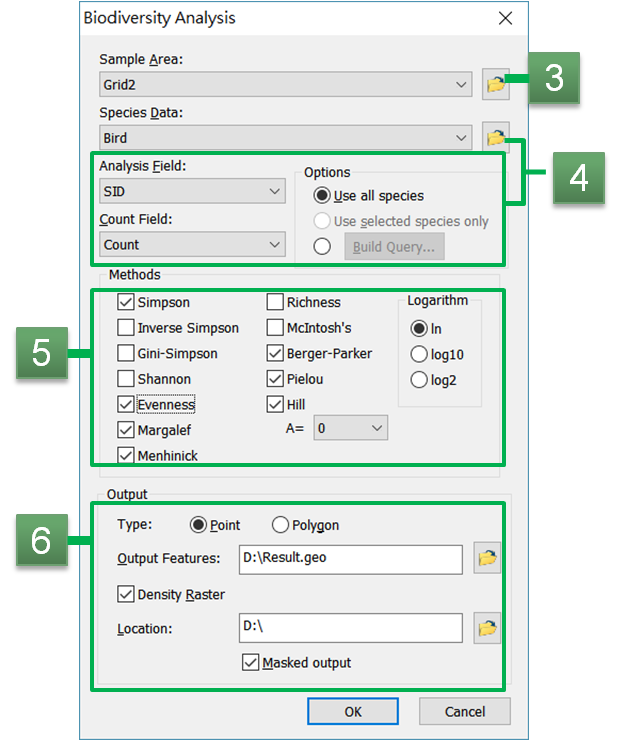
3.Click the dropdown arrow of Sample Area and select the grid layer.
4.Click the dropdown arrow of Species Data to display the layer menu. Select a layer that contains biological data for analysis.
5.Select the methods.
6.Determine whether to output the image and mask output.
7.Click OK to generate the analysis results.
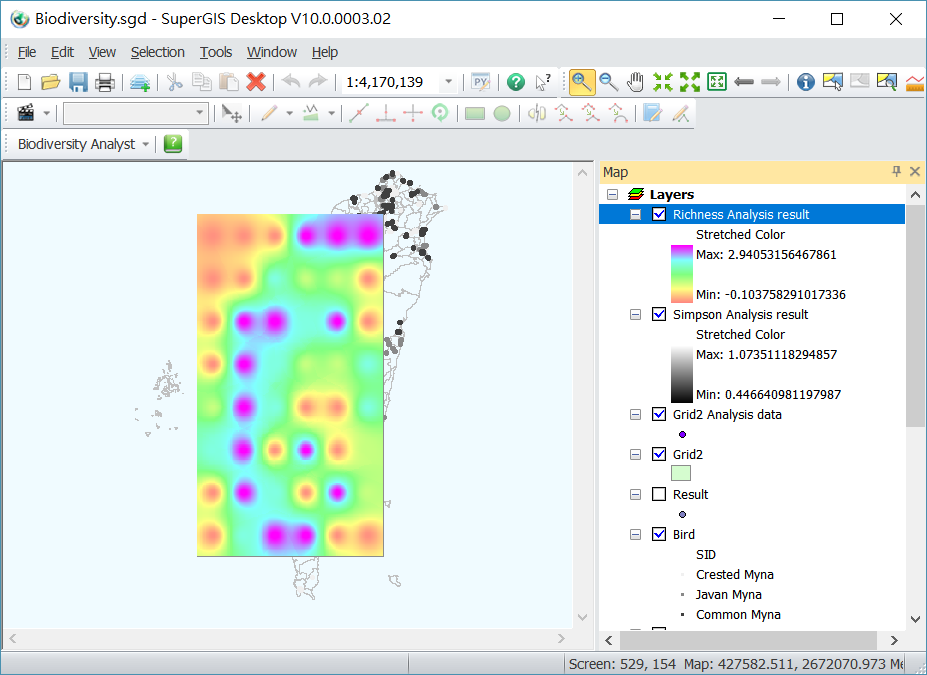
8.The result are generated after analysis.
© 2017 Supergeo Technologies Inc. All Rights Reserved.