Contour
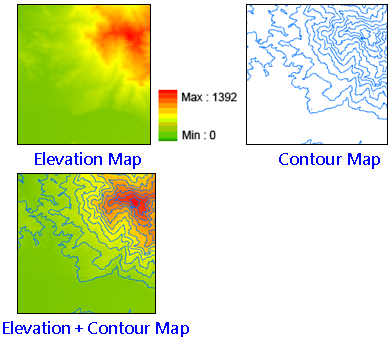
Contours are lines that connect some geographic conditions or phenomena of the equal value. That is, a union made by the lines of equal value. Different kinds of value have different term, such as isotherms, isohyets, isobars and isolines. Through the distribution of contours, users can understand the change of the surface. For instance, if the terrain is flat, the interval between the isolines is wider; if the terrain is steep, the isolines have narrow interval. This analysis is suitable for show the distribution of continuous phenomena instead of a sudden phenomenon.
With the contours, the areas with the identical values can be identified. If it is used in terrain, you can simulate the slope by visualize the contours. See the figure of the left, the terrain type can be identified on DTM but not the slope. If with the contours, the steep and flat areas (evaluated by the contour interval), ridge and valley (the convergence of contour) can be clearly identified.
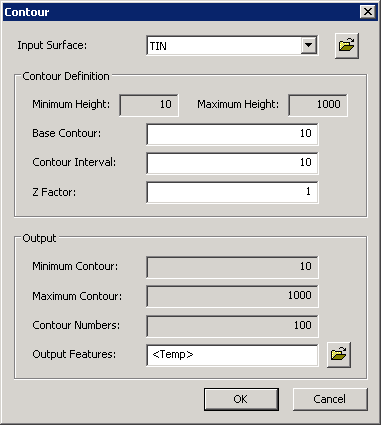
Description of Parameters
©2016 Supergeo Technologies Inc. All rights reserved. |